1.2.1. PANDAS#
print ('hello Pandas')
hello Pandas
1.2.1.1. Pandas basic#
1.2.1.1.1. Pandas Getting Started (bắt đầu pandas)#
import pandas as pd

mydataset = {
  'cars': ["BMW", "Volvo", "Ford"],
  'passings': [3, 7, 2]
}

myvar = pd.DataFrame(mydataset)

print(myvar)
    cars  passings
0    BMW         3
1  Volvo         7
2   Ford         2
DataFrame là một cấu trúc dữ liệu hai chiều trong thư viện pandas của Python, cho phép bạn lưu trữ và xử lý dữ liệu có cấu trúc hoặc chuỗi thời gian.
DataFrame có các nhãn cho các hàng và cột, giống như một bảng SQL hoặc một bảng tính Excel.
Bạn có thể tạo DataFrame từ nhiều nguồn dữ liệu khác nhau, như danh sách, từ điển, mảng NumPy, Series, tệp văn bản, cơ sở dữ liệu hoặc web.
DataFrame cung cấp nhiều chức năng hữu ích để thao tác, lọc, nhóm, sắp xếp, thống kê và trực quan hóa dữ liệu.
1.2.1.1.1.1. Checking Pandas Version (kiểm tra phiên bản padas)#
import pandas as pd

print(pd.__version__)
2.2.2
1.2.1.1.2. pandas series (dòng/chuỗi pandas)#
import pandas as pd

a = [1, 7,  2]

myvar = pd.Series(a)

print(myvar)
0    1
1    7
2    2
dtype: int64
series : chuỗi
0,1,2 là vị trí của nó
1.2.1.1.2.1. Labels (nhãn)#
import pandas as pd

a = [1, 7,  2]

myvar = pd.Series(a)

print(myvar)
print(myvar[0])
0    1
1    7
2    2
dtype: int64
1
myvar[0] : đây là cách để truy cập 1(nhãn) vị trí được chỉ đinh trong cặp dấu []
1.2.1.1.2.2. Create Labels (tạo nhãn)#
tạo nhãn
import pandas as pd

a = [1, 7, 2]

myvar = pd.Series(a, index = ["x", "y", "z"])

print(myvar)
x    1
y    7
z    2
dtype: int64
ta thay thứ tự của 0,1,2 thành x,y,z
khi muốn lấy nó thì phải đưa vài cặp dấu ‘’ hoặc “”
print(myvar[1])
print(myvar['y'])
7
7
1.2.1.1.2.3. Key/Value Objects as Series(Đối tượng Khóa/Giá trị dưới dạng chuỗi)#
Tạo một chuỗi Pandas đơn giản.
Lưu ý: Các khóa của từ điển trở thành nhãn.
import pandas as pd

calories = {"day1": 420, "day2": 380, "day3": 390}

myvar = pd.Series(calories)

print(myvar)
print(myvar['day2'])
day1    420
day2    380
day3    390
dtype: int64
380
Tạo Chuỗi chỉ sử dụng dữ liệu từ “day1” và “day2”.
Để chỉ chọn một số mục trong từ điển, hãy sử dụng index đối số và chỉ định các mục bạn muốn đưa vào series.
import pandas as pd

calories = {"day1": 420, "day2": 380, "day3": 390}

myvar = pd.Series(calories, index = ["day1", "day2"])

print(myvar)
day1    420
day2    380
dtype: int64
1.2.1.1.3. DataFrames (Khung dữ liệu)#
1.2.1.1.3.1. khởi tạo DataFrames#
1.2.1.1.3.1.1. Khởi tạo DataFrames thông qua dictionary#
Dictionary : từ điển
Hàm display của IPython giúp cho DataFrame hiển thị được trên code khi run dưới dạng script file.
Các options của pd.set_option() lần lượt có tác dụng:
max_colwidth: Qui định chiều rộng tối đa của một cột.
precision: Độ chính xác của các sau dấu phảy của các cột định dạng float.
max_columns, max_rows: Lần lượt là độ số lượng cột và số lượng dòng tối đa được hiển thị.
import pandas as pd
from IPython.display import display


dict_columns = {
    'contents':['Author', 'Book', 'Target', 'No_Donation'],
    'infos':['Pham Dinh Khanh', 'ML algorithms to Practice', 'Vi mot cong dong AI vung manh hon', 'Community'],
    'numbers':[1993, 2021, 1, 2]
}

df = pd.DataFrame(dict_columns)
display(df)
| contents | infos | numbers | |
|---|---|---|---|
| 0 | Author | Pham Dinh Khanh | 1993 |
| 1 | Book | ML algorithms to Practice | 2021 |
| 2 | Target | Vi mot cong dong AI vung manh hon | 1 |
| 3 | No_Donation | Community | 2 |
1.2.1.1.3.1.2. Khởi tạo DataFrames thông qua list#
import pandas as pd

records = [('Author', 'Pham Dinh Khanh', 1993),
           ('Book', 'ML algorithms to Practice', 2021),
           ('Target', 'Vi mot cong dong AI vung manh hon', 1),
           ('No_Donation', 'Community', 2)]

# Khởi tạo DataFrame
df = pd.DataFrame(data = records, columns = ['contents', 'infos', 'numbers'])
df
| contents | infos | numbers | |
|---|---|---|---|
| 0 | Author | Pham Dinh Khanh | 1993 |
| 1 | Book | ML algorithms to Practice | 2021 |
| 2 | Target | Vi mot cong dong AI vung manh hon | 1 |
| 3 | No_Donation | Community | 2 |
df.to_csv("data.csv")
1.2.1.1.3.1.3. Cách đọc dữ liệu từ file#
ta dùng cấu trúc pd.reac_csv(…)
import pandas as pd

df = pd.read_csv("https://raw.githubusercontent.com/phamdinhkhanh/datasets/master/BostonHousing.csv", sep=",", header = 0, index_col = None)
df.head()
| crim | zn | indus | chas | nox | rm | age | dis | rad | tax | ptratio | b | lstat | medv | |
|---|---|---|---|---|---|---|---|---|---|---|---|---|---|---|
| 0 | 0.00632 | 18.0 | 2.31 | 0 | 0.538 | 6.575 | 65.2 | 4.0900 | 1 | 296 | 15.3 | 396.90 | 4.98 | 24.0 |
| 1 | 0.02731 | 0.0 | 7.07 | 0 | 0.469 | 6.421 | 78.9 | 4.9671 | 2 | 242 | 17.8 | 396.90 | 9.14 | 21.6 |
| 2 | 0.02729 | 0.0 | 7.07 | 0 | 0.469 | 7.185 | 61.1 | 4.9671 | 2 | 242 | 17.8 | 392.83 | 4.03 | 34.7 |
| 3 | 0.03237 | 0.0 | 2.18 | 0 | 0.458 | 6.998 | 45.8 | 6.0622 | 3 | 222 | 18.7 | 394.63 | 2.94 | 33.4 |
| 4 | 0.06905 | 0.0 | 2.18 | 0 | 0.458 | 7.147 | 54.2 | 6.0622 | 3 | 222 | 18.7 | 396.90 | 5.33 | 36.2 |
Trong hàm pd.read_csv() chúng ta sẽ khai báo các thông số chính bao gồm :
sep: Là viết tắt của seperator, ký hiệu ngăn cách các trường trong cùng một dòng, thường và mặc định là dấu phảy.
header: Mặc định là indice của dòng được chọn làm column name. Thường là dòng đầu tiên của file. Trường hợp file không có header thì để header = None. Khi đó indices cho column name sẽ được mặc định là các số tự nhiên liên tiếp từ 0 cho đến indice column cuối cùng.
index_col: Là indice của column được sử dụng làm giá trị index cho dataframe. Cột index phải có giá trị khác nhau để phân biệt giữa các dòng và khi chúng ta để index_col = None thì giá trị index sẽ được đánh mặc định từ 0 cho đến dòng cuối cùng.
Hàm df.head() mặc định sẽ hiển thị ra 5 quan sát đầu tiên của dataframe. Chúng ta muốn hiển thị 5 quan sát cuối cùng thì dùng hàm df.tail() và 5 quan sát ngẫu nhiên thì dùng hàm df.sample(5).
### Hàm df.info() sẽ cho ta biết định dạng và số lượng quan sát not-null của mỗi trường trong dataframe
import pandas as pd
df = pd.read_csv("https://raw.githubusercontent.com/phamdinhkhanh/datasets/master/BostonHousing.csv", sep=",", header = 0, index_col = None)
df.info()
<class 'pandas.core.frame.DataFrame'>
RangeIndex: 506 entries, 0 to 505
Data columns (total 14 columns):
 #   Column   Non-Null Count  Dtype
---  ------   --------------  -----
 0   crim     506 non-null    float64
 1   zn       506 non-null    float64
 2   indus    506 non-null    float64
 3   chas     506 non-null    int64
 4   nox      506 non-null    float64
 5   rm       506 non-null    float64
 6   age      506 non-null    float64
 7   dis      506 non-null    float64
 8   rad      506 non-null    int64
 9   tax      506 non-null    int64
 10  ptratio  506 non-null    float64
 11  b        506 non-null    float64
 12  lstat    506 non-null    float64
 13  medv     506 non-null    float64
dtypes: float64(11), int64(3)
memory usage: 55.5 KB
### hàm df.dtypes để kiểm tra định dạng dữ liệu các trường của một bảng.
import pandas as pd
df = pd.read_csv("https://raw.githubusercontent.com/phamdinhkhanh/datasets/master/BostonHousing.csv", sep=",", header = 0, index_col = None)
# Check for datatype
df.dtypes
crim       float64
zn         float64
indus      float64
chas         int64
nox        float64
rm         float64
age        float64
dis        float64
rad          int64
tax          int64
ptratio    float64
b          float64
lstat      float64
medv       float64
dtype: object
### Nếu muốn kiểm tra chi tiết hơn những thống kê mô tả của dataframe như trung bình, phương sai, min, max, median
##của một trường dữ liệu chúng ta dùng hàm df.describe()
import pandas as pd

df = pd.read_csv("https://raw.githubusercontent.com/phamdinhkhanh/datasets/master/BostonHousing.csv", sep=",", header = 0, index_col = None)
df.describe()
| crim | zn | indus | chas | nox | rm | age | dis | rad | tax | ptratio | b | lstat | medv | |
|---|---|---|---|---|---|---|---|---|---|---|---|---|---|---|
| count | 506.000000 | 506.000000 | 506.000000 | 506.000000 | 506.000000 | 506.000000 | 506.000000 | 506.000000 | 506.000000 | 506.000000 | 506.000000 | 506.000000 | 506.000000 | 506.000000 |
| mean | 3.613524 | 11.363636 | 11.136779 | 0.069170 | 0.554695 | 6.284634 | 68.574901 | 3.795043 | 9.549407 | 408.237154 | 18.455534 | 356.674032 | 12.653063 | 22.532806 |
| std | 8.601545 | 23.322453 | 6.860353 | 0.253994 | 0.115878 | 0.702617 | 28.148861 | 2.105710 | 8.707259 | 168.537116 | 2.164946 | 91.294864 | 7.141062 | 9.197104 |
| min | 0.006320 | 0.000000 | 0.460000 | 0.000000 | 0.385000 | 3.561000 | 2.900000 | 1.129600 | 1.000000 | 187.000000 | 12.600000 | 0.320000 | 1.730000 | 5.000000 |
| 25% | 0.082045 | 0.000000 | 5.190000 | 0.000000 | 0.449000 | 5.885500 | 45.025000 | 2.100175 | 4.000000 | 279.000000 | 17.400000 | 375.377500 | 6.950000 | 17.025000 |
| 50% | 0.256510 | 0.000000 | 9.690000 | 0.000000 | 0.538000 | 6.208500 | 77.500000 | 3.207450 | 5.000000 | 330.000000 | 19.050000 | 391.440000 | 11.360000 | 21.200000 |
| 75% | 3.677083 | 12.500000 | 18.100000 | 0.000000 | 0.624000 | 6.623500 | 94.075000 | 5.188425 | 24.000000 | 666.000000 | 20.200000 | 396.225000 | 16.955000 | 25.000000 |
| max | 88.976200 | 100.000000 | 27.740000 | 1.000000 | 0.871000 | 8.780000 | 100.000000 | 12.126500 | 24.000000 | 711.000000 | 22.000000 | 396.900000 | 37.970000 | 50.000000 |
1.2.1.1.3.1.4. Export to CSV, EXCEL, TXT, JSON#
Đây là câu lệnh được sử dụng khá phổ biến để lưu trữ các file dữ liệu từ dataframe sang những định dạng khác nhau. Những định dạng này sẽ cho phép chúng ta load lại dữ liệu bằng các hàm read_csv(), read_xlsx(), read_txt(), read_json() sau đó.
%%script echo skipping

# Lưu dữ liệu sang file csv
df.to_csv('BostonHousing.csv', index = False)
# Lưu file excel
df.to_excel('BostonHousing.xls', index = False)
# Lưu dữ file json
df.to_json('BostonHousing.json') #do not include index = False, index only use for table orient
Couldn't find program: 'echo'
### tạo dataFrames từ 2 series
### Pandas DataFrame là cấu trúc dữ liệu 2 chiều, giống như mảng 2 chiều hoặc bảng có hàng và cột.
import pandas as pd
data = {"calories": [420, 380, 390],"duration": [50, 40, 45]}
myvar = pd.DataFrame(data)
myvar ### để là myvar thì dòng hiện lên sẽ đẹp hơn để print (myvar)
| calories | duration | |
|---|---|---|
| 0 | 420 | 50 |
| 1 | 380 | 40 |
| 2 | 390 | 45 |
1.2.1.1.3.2. Thao tác với DataFrame#
1.2.1.1.3.2.1. Truy cập vào DataFrame#
Cách 1: Truy cập theo slice index:
# Lựa chọn 5 dòng đầu và 5 cột đầu của df
### iloc là viết tắt của indice location, tức là truy cập quan indice.
import pandas as pd
df = pd.read_csv("https://raw.githubusercontent.com/phamdinhkhanh/datasets/master/BostonHousing.csv", sep=",", header = 0, index_col = None)
df.describe()
df.iloc[:5, :5]
| crim | zn | indus | chas | nox | |
|---|---|---|---|---|---|
| 0 | 0.00632 | 18.0 | 2.31 | 0 | 0.538 |
| 1 | 0.02731 | 0.0 | 7.07 | 0 | 0.469 |
| 2 | 0.02729 | 0.0 | 7.07 | 0 | 0.469 |
| 3 | 0.03237 | 0.0 | 2.18 | 0 | 0.458 |
| 4 | 0.06905 | 0.0 | 2.18 | 0 | 0.458 |
# Lựa chọn 5 dòng từ 5:10 và 2 cột từ 2:4
df.iloc[5:10, 2:4]
| indus | chas | |
|---|---|---|
| 5 | 2.18 | 0 |
| 6 | 7.87 | 0 |
| 7 | 7.87 | 0 |
| 8 | 7.87 | 0 |
| 9 | 7.87 | 0 |
# Lựa chọn 5 dòng cuối và các cột 1 và 3
df.iloc[-5:, [1, 3]]
| zn | chas | |
|---|---|---|
| 501 | 0.0 | 0 |
| 502 | 0.0 | 0 |
| 503 | 0.0 | 0 |
| 504 | 0.0 | 0 |
| 505 | 0.0 | 0 |
# Truy cập các dòng có index là 10:15
df.loc[10:15]
| crim | zn | indus | chas | nox | rm | age | dis | rad | tax | ptratio | b | lstat | medv | |
|---|---|---|---|---|---|---|---|---|---|---|---|---|---|---|
| 10 | 0.22489 | 12.5 | 7.87 | 0 | 0.524 | 6.377 | 94.3 | 6.3467 | 5 | 311 | 15.2 | 392.52 | 20.45 | 15.0 |
| 11 | 0.11747 | 12.5 | 7.87 | 0 | 0.524 | 6.009 | 82.9 | 6.2267 | 5 | 311 | 15.2 | 396.90 | 13.27 | 18.9 |
| 12 | 0.09378 | 12.5 | 7.87 | 0 | 0.524 | 5.889 | 39.0 | 5.4509 | 5 | 311 | 15.2 | 390.50 | 15.71 | 21.7 |
| 13 | 0.62976 | 0.0 | 8.14 | 0 | 0.538 | 5.949 | 61.8 | 4.7075 | 4 | 307 | 21.0 | 396.90 | 8.26 | 20.4 |
| 14 | 0.63796 | 0.0 | 8.14 | 0 | 0.538 | 6.096 | 84.5 | 4.4619 | 4 | 307 | 21.0 | 380.02 | 10.26 | 18.2 |
| 15 | 0.62739 | 0.0 | 8.14 | 0 | 0.538 | 5.834 | 56.5 | 4.4986 | 4 | 307 | 21.0 | 395.62 | 8.47 | 19.9 |
Cách 2: Truy cập theo column names:
import pandas as pd
df = pd.read_csv("https://raw.githubusercontent.com/phamdinhkhanh/datasets/master/BostonHousing.csv", sep=",", header = 0, index_col = None)
df.describe()
df[['crim', 'tax', 'rad']].head()
| crim | tax | rad | |
|---|---|---|---|
| 0 | 0.00632 | 296 | 1 |
| 1 | 0.02731 | 242 | 2 |
| 2 | 0.02729 | 242 | 2 |
| 3 | 0.03237 | 222 | 3 |
| 4 | 0.06905 | 222 | 3 |
################################## Kết hợp cả hai cách:
import pandas as pd
df = pd.read_csv("https://raw.githubusercontent.com/phamdinhkhanh/datasets/master/BostonHousing.csv", sep=",", header = 0, index_col = None)
df.describe()
df[['crim', 'tax', 'rad']].iloc[10:15]
| crim | tax | rad | |
|---|---|---|---|
| 10 | 0.22489 | 311 | 5 |
| 11 | 0.11747 | 311 | 5 |
| 12 | 0.09378 | 311 | 5 |
| 13 | 0.62976 | 307 | 4 |
| 14 | 0.63796 | 307 | 4 |
1.2.1.1.3.2.2. Lọc DataFrame#
Giả sử chúng ta muốn lọc ra các thị trấn mà có số phòng ở trung bình trên căn hộ là trên 4
thì truyền vào dấu [] điều kiện df[‘rm’] > 4.
import pandas as pd
df = pd.read_csv("https://raw.githubusercontent.com/phamdinhkhanh/datasets/master/BostonHousing.csv", sep=",", header = 0, index_col = None)
df[df['rm'] > 4].head()
| crim | zn | indus | chas | nox | rm | age | dis | rad | tax | ptratio | b | lstat | medv | |
|---|---|---|---|---|---|---|---|---|---|---|---|---|---|---|
| 0 | 0.00632 | 18.0 | 2.31 | 0 | 0.538 | 6.575 | 65.2 | 4.0900 | 1 | 296 | 15.3 | 396.90 | 4.98 | 24.0 |
| 1 | 0.02731 | 0.0 | 7.07 | 0 | 0.469 | 6.421 | 78.9 | 4.9671 | 2 | 242 | 17.8 | 396.90 | 9.14 | 21.6 |
| 2 | 0.02729 | 0.0 | 7.07 | 0 | 0.469 | 7.185 | 61.1 | 4.9671 | 2 | 242 | 17.8 | 392.83 | 4.03 | 34.7 |
| 3 | 0.03237 | 0.0 | 2.18 | 0 | 0.458 | 6.998 | 45.8 | 6.0622 | 3 | 222 | 18.7 | 394.63 | 2.94 | 33.4 |
| 4 | 0.06905 | 0.0 | 2.18 | 0 | 0.458 | 7.147 | 54.2 | 6.0622 | 3 | 222 | 18.7 | 396.90 | 5.33 | 36.2 |
Nếu chúng ta muốn kết hợp nhiều điều kiện thì dùng biểu thức logic and hoặc or.
lọc thêm điều kiện thuế suất trên 250 ngoài điều kiện số phòng thì ta làm như sau:
df[(df['rm']>4) & (df['tax']>250)].head()
| crim | zn | indus | chas | nox | rm | age | dis | rad | tax | ptratio | b | lstat | medv | |
|---|---|---|---|---|---|---|---|---|---|---|---|---|---|---|
| 0 | 0.00632 | 18.0 | 2.31 | 0 | 0.538 | 6.575 | 65.2 | 4.0900 | 1 | 296 | 15.3 | 396.90 | 4.98 | 24.0 |
| 6 | 0.08829 | 12.5 | 7.87 | 0 | 0.524 | 6.012 | 66.6 | 5.5605 | 5 | 311 | 15.2 | 395.60 | 12.43 | 22.9 |
| 7 | 0.14455 | 12.5 | 7.87 | 0 | 0.524 | 6.172 | 96.1 | 5.9505 | 5 | 311 | 15.2 | 396.90 | 19.15 | 27.1 |
| 8 | 0.21124 | 12.5 | 7.87 | 0 | 0.524 | 5.631 | 100.0 | 6.0821 | 5 | 311 | 15.2 | 386.63 | 29.93 | 16.5 |
| 9 | 0.17004 | 12.5 | 7.87 | 0 | 0.524 | 6.004 | 85.9 | 6.5921 | 5 | 311 | 15.2 | 386.71 | 17.10 | 18.9 |
1.2.1.1.3.2.2.1. lọc các cột theo định dạng dữ liệu#
### Ta dùng hàm df.select_dtypes() để lọc các cột theo định dạng dữ liệu. Những định dạng chính bao gồm integer, float, object, boolean.
### Ví dụ: lọc các trường có định dạng dữ liệu là float.
df.select_dtypes('float').head()
| crim | zn | indus | nox | rm | age | dis | ptratio | b | lstat | medv | |
|---|---|---|---|---|---|---|---|---|---|---|---|
| 0 | 0.00632 | 18.0 | 2.31 | 0.538 | 6.575 | 65.2 | 4.0900 | 15.3 | 396.90 | 4.98 | 24.0 |
| 1 | 0.02731 | 0.0 | 7.07 | 0.469 | 6.421 | 78.9 | 4.9671 | 17.8 | 396.90 | 9.14 | 21.6 |
| 2 | 0.02729 | 0.0 | 7.07 | 0.469 | 7.185 | 61.1 | 4.9671 | 17.8 | 392.83 | 4.03 | 34.7 |
| 3 | 0.03237 | 0.0 | 2.18 | 0.458 | 6.998 | 45.8 | 6.0622 | 18.7 | 394.63 | 2.94 | 33.4 |
| 4 | 0.06905 | 0.0 | 2.18 | 0.458 | 7.147 | 54.2 | 6.0622 | 18.7 | 396.90 | 5.33 | 36.2 |
df.select_dtypes('integer').head()
| chas | rad | tax | |
|---|---|---|---|
| 0 | 0 | 1 | 296 |
| 1 | 0 | 2 | 242 |
| 2 | 0 | 2 | 242 |
| 3 | 0 | 3 | 222 |
| 4 | 0 | 3 | 222 |
df.select_dtypes('boolean').head()
### vì k có kiểu dữ liệu boolean lên sẽ k có dữ liệu
| 0 |
|---|
| 1 |
| 2 |
| 3 |
| 4 |
1.2.1.1.3.2.2.2. Lọc các cột theo pattern của tên cột#
pattern : mẫu
###Khi làm việc với dữ liệu lớn sẽ có những tình huống mà bạn bắt gặp các cột thuộc về cùng một nhóm
###và chúng có chung một pattern.
### dùng hàm filter
df2 = pd.DataFrame({
    'name':['a', 'b', 'c', 'd', 'e'],
    'age_1':[1, 2, 3, 4, 5],
    'age_2':[3, 5, 7, 9 , 10],
    'age_3':[2, 5, 2, 5, 6]
})

df2.head()
| name | age_1 | age_2 | age_3 | |
|---|---|---|---|---|
| 0 | a | 1 | 3 | 2 |
| 1 | b | 2 | 5 | 5 |
| 2 | c | 3 | 7 | 2 |
| 3 | d | 4 | 9 | 5 |
| 4 | e | 5 | 10 | 6 |
###Lựa chọn các cột bắt đầu là age thông qua hàm filter.
### axis=1 là làm việc với cột và axis=0 là làm việc với dòng
### Giá trị của regex=^age có nghĩa là lọc các cột có chuỗi ký tự là age đứng đầu.
df2.filter(regex='^age', axis=1)
| age_1 | age_2 | age_3 | |
|---|---|---|---|
| 0 | 1 | 3 | 2 |
| 1 | 2 | 5 | 5 |
| 2 | 3 | 7 | 2 |
| 3 | 4 | 9 | 5 |
| 4 | 5 | 10 | 6 |
1.2.1.1.3.2.3. Sort dữ liệu#
### sử dụng hàm df.sort_values(.) với Lựa chọn là ascending = True giúp sort theo thứ tự tăng dần, trường hợp False sẽ giảm dần.
#Giả sử bên dưới chúng ta cùng sort giá trị của căn nhà theo chiều giảm dần.

#Sort data
df.sort_values('medv', ascending = False).head()
| crim | zn | indus | chas | nox | rm | age | dis | rad | tax | ptratio | b | lstat | medv | |
|---|---|---|---|---|---|---|---|---|---|---|---|---|---|---|
| 283 | 0.01501 | 90.0 | 1.21 | 1 | 0.401 | 7.923 | 24.8 | 5.8850 | 1 | 198 | 13.6 | 395.52 | 3.16 | 50.0 |
| 225 | 0.52693 | 0.0 | 6.20 | 0 | 0.504 | 8.725 | 83.0 | 2.8944 | 8 | 307 | 17.4 | 382.00 | 4.63 | 50.0 |
| 369 | 5.66998 | 0.0 | 18.10 | 1 | 0.631 | 6.683 | 96.8 | 1.3567 | 24 | 666 | 20.2 | 375.33 | 3.73 | 50.0 |
| 370 | 6.53876 | 0.0 | 18.10 | 1 | 0.631 | 7.016 | 97.5 | 1.2024 | 24 | 666 | 20.2 | 392.05 | 2.96 | 50.0 |
| 371 | 9.23230 | 0.0 | 18.10 | 0 | 0.631 | 6.216 | 100.0 | 1.1691 | 24 | 666 | 20.2 | 366.15 | 9.53 | 50.0 |
df.sort_values(['medv', 'tax'], ascending = False).head()
| crim | zn | indus | chas | nox | rm | age | dis | rad | tax | ptratio | b | lstat | medv | |
|---|---|---|---|---|---|---|---|---|---|---|---|---|---|---|
| 368 | 4.89822 | 0.0 | 18.1 | 0 | 0.631 | 4.970 | 100.0 | 1.3325 | 24 | 666 | 20.2 | 375.52 | 3.26 | 50.0 |
| 369 | 5.66998 | 0.0 | 18.1 | 1 | 0.631 | 6.683 | 96.8 | 1.3567 | 24 | 666 | 20.2 | 375.33 | 3.73 | 50.0 |
| 370 | 6.53876 | 0.0 | 18.1 | 1 | 0.631 | 7.016 | 97.5 | 1.2024 | 24 | 666 | 20.2 | 392.05 | 2.96 | 50.0 |
| 371 | 9.23230 | 0.0 | 18.1 | 0 | 0.631 | 6.216 | 100.0 | 1.1691 | 24 | 666 | 20.2 | 366.15 | 9.53 | 50.0 |
| 372 | 8.26725 | 0.0 | 18.1 | 1 | 0.668 | 5.875 | 89.6 | 1.1296 | 24 | 666 | 20.2 | 347.88 | 8.88 | 50.0 |
1.2.1.1.3.2.4. Các hàm đối với một trường#
1.2.1.1.3.2.4.1. Min, max, mean, meadian, sum#
### tính giá trị cho từng trường
print(df['tax'].min(), df['tax'].max(), df['tax'].mean(), df['tax'].median(), df['tax'].sum())
187 711 408.2371541501976 330.0 206568
1.2.1.1.3.2.4.2. Hàm cut#
### Hàm cut giúp ta phân chia giá trị của một trường liên tục vào những khoảng theo ngưỡng cắt.
###Kết quả trả ra là nhãn của từng khoảng mà chúng ta khai báo.

bins = [-999999, 250, 400, 999999]
labels = ['low', 'normal', 'high']
# low: -999999 < 250
# normal: 250 <- 400
# high: 400 <- 999999
df['tax_labels'] = pd.cut(df['tax'], bins=bins, labels=labels)
df[df['tax_labels']=='high'].head()

### high là cái khoảng ở trên
| crim | zn | indus | chas | nox | rm | age | dis | rad | tax | ptratio | b | lstat | medv | tax_labels | |
|---|---|---|---|---|---|---|---|---|---|---|---|---|---|---|---|
| 54 | 0.01360 | 75.0 | 4.00 | 0 | 0.410 | 5.888 | 47.6 | 7.3197 | 3 | 469 | 21.1 | 396.90 | 14.80 | 18.9 | high |
| 111 | 0.10084 | 0.0 | 10.01 | 0 | 0.547 | 6.715 | 81.6 | 2.6775 | 6 | 432 | 17.8 | 395.59 | 10.16 | 22.8 | high |
| 112 | 0.12329 | 0.0 | 10.01 | 0 | 0.547 | 5.913 | 92.9 | 2.3534 | 6 | 432 | 17.8 | 394.95 | 16.21 | 18.8 | high |
| 113 | 0.22212 | 0.0 | 10.01 | 0 | 0.547 | 6.092 | 95.4 | 2.5480 | 6 | 432 | 17.8 | 396.90 | 17.09 | 18.7 | high |
| 114 | 0.14231 | 0.0 | 10.01 | 0 | 0.547 | 6.254 | 84.2 | 2.2565 | 6 | 432 | 17.8 | 388.74 | 10.45 | 18.5 | high |
bins = [-999999, 250, 400, 999999]
labels = ['low', 'normal', 'high']
# low: -999999 < 250
# normal: 250 <- 400
# high: 400 <- 999999
df['tax_labels'] = pd.cut(df['tax'], bins=bins, labels=labels)
df[df['tax_labels']=='normal'].head()
### đây là normal
| crim | zn | indus | chas | nox | rm | age | dis | rad | tax | ptratio | b | lstat | medv | tax_labels | |
|---|---|---|---|---|---|---|---|---|---|---|---|---|---|---|---|
| 0 | 0.00632 | 18.0 | 2.31 | 0 | 0.538 | 6.575 | 65.2 | 4.0900 | 1 | 296 | 15.3 | 396.90 | 4.98 | 24.0 | normal |
| 6 | 0.08829 | 12.5 | 7.87 | 0 | 0.524 | 6.012 | 66.6 | 5.5605 | 5 | 311 | 15.2 | 395.60 | 12.43 | 22.9 | normal |
| 7 | 0.14455 | 12.5 | 7.87 | 0 | 0.524 | 6.172 | 96.1 | 5.9505 | 5 | 311 | 15.2 | 396.90 | 19.15 | 27.1 | normal |
| 8 | 0.21124 | 12.5 | 7.87 | 0 | 0.524 | 5.631 | 100.0 | 6.0821 | 5 | 311 | 15.2 | 386.63 | 29.93 | 16.5 | normal |
| 9 | 0.17004 | 12.5 | 7.87 | 0 | 0.524 | 6.004 | 85.9 | 6.5921 | 5 | 311 | 15.2 | 386.71 | 17.10 | 18.9 | normal |
bins = [-999999, 250, 400, 999999]
labels = ['low', 'normal', 'high']
df['tax_labels'] = pd.cut(df['tax'], bins=bins, labels=labels)
df[df['tax_labels']=='low'].head()
| crim | zn | indus | chas | nox | rm | age | dis | rad | tax | ptratio | b | lstat | medv | tax_labels | |
|---|---|---|---|---|---|---|---|---|---|---|---|---|---|---|---|
| 1 | 0.02731 | 0.0 | 7.07 | 0 | 0.469 | 6.421 | 78.9 | 4.9671 | 2 | 242 | 17.8 | 396.90 | 9.14 | 21.6 | low |
| 2 | 0.02729 | 0.0 | 7.07 | 0 | 0.469 | 7.185 | 61.1 | 4.9671 | 2 | 242 | 17.8 | 392.83 | 4.03 | 34.7 | low |
| 3 | 0.03237 | 0.0 | 2.18 | 0 | 0.458 | 6.998 | 45.8 | 6.0622 | 3 | 222 | 18.7 | 394.63 | 2.94 | 33.4 | low |
| 4 | 0.06905 | 0.0 | 2.18 | 0 | 0.458 | 7.147 | 54.2 | 6.0622 | 3 | 222 | 18.7 | 396.90 | 5.33 | 36.2 | low |
| 5 | 0.02985 | 0.0 | 2.18 | 0 | 0.458 | 6.430 | 58.7 | 6.0622 | 3 | 222 | 18.7 | 394.12 | 5.21 | 28.7 | low |
1.2.1.1.3.2.4.3. Hàm qcut#
import pandas as pd
import numpy as np

labels = ['low', 'normal', 'high']
tax_labels = pd.qcut(df['tax'], q=3, labels=labels)
np.unique(tax_labels, return_counts = True)
(array(['high', 'low', 'normal'], dtype=object),
 array([168, 172, 166], dtype=int64))
1.2.1.1.3.2.4.4. Apply#
# Apply : áp dụng
## Apply sẽ giúp ta biến đổi giá trị của một trường theo một hàm số xác định trước.
#Hàm số biến đổi được áp dụng trong apply sẽ là một hàm lamda.
#Hàm lambda là một khái niệm rất quan trọng trong python, hàm số này có cú pháp dạng lambda x: formula.
df['tax'].apply(lambda x: 2*x).head()
0    592
1    484
2    484
3    444
4    444
Name: tax, dtype: int64
Ta cũng có thể áp dụng cho nhiều trường một lúc. Khi đó cần khai báo axis=1 để biết rằng ta đang áp dụng trên từng cột, nếu axis=0 thì sẽ áp dụng trên từng dòng.
df[['tax', 'medv']].apply(lambda x: 2*x, axis=1).head()
| tax | medv | |
|---|---|---|
| 0 | 592.0 | 48.0 |
| 1 | 484.0 | 43.2 |
| 2 | 484.0 | 69.4 |
| 3 | 444.0 | 66.8 |
| 4 | 444.0 | 72.4 |
1.2.1.1.3.2.4.5. Map#
##Map là hàm giúp biến đổi giá trị của một biến sang giá trị mới dựa trên dictionary mà chúng ta áp dụng.
##Giá trị cũ sẽ là key và giá trị mới sẽ là value.
dict_tax = {
      'low':'thap',
      'normal':'tb',
      'high':'cao'
    }

df['tax_labels'].map(dict_tax).head(10)
0      tb
1    thap
2    thap
3    thap
4    thap
5    thap
6      tb
7      tb
8      tb
9      tb
Name: tax_labels, dtype: category
Categories (3, object): ['thap' < 'tb' < 'cao']
1.2.1.1.3.2.5. Biểu đồ matplotlib trên pandas#
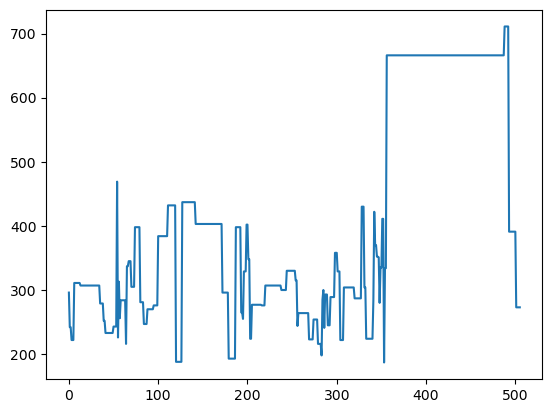
biểu đồ line
# 1. biểu đồ line
df['tax'].plot()
<Axes: >
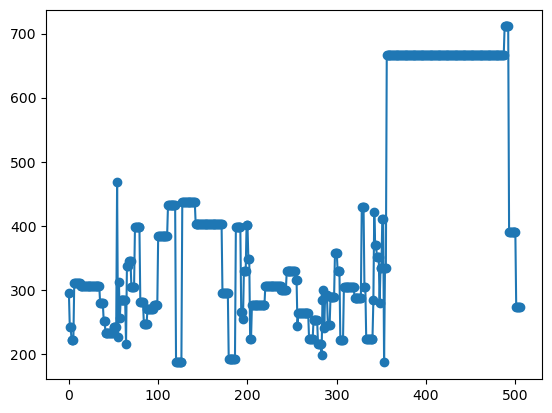
Biểu đồ line kết hợp với point
# 2. Biểu đồ line kết hợp với point
df['tax'].plot(marker='o')
<Axes: >
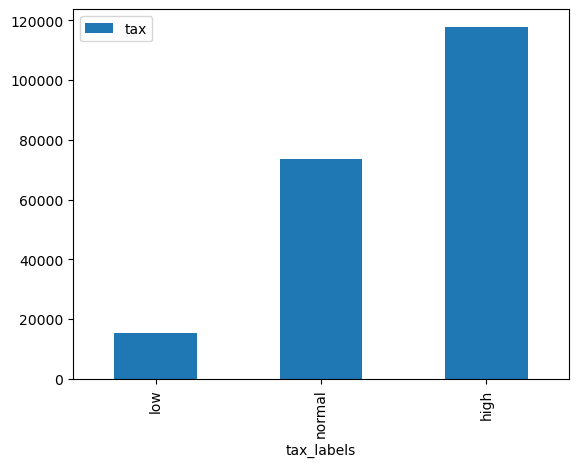
Biểu đồ barchart
# 3. Biểu đồ barchart
###Ở đây ta sẽ phải dùng thêm hàm groupby để tạo thành bảng thống kê tổng thuế theo tax_labels rồi mới vẽ biểu đồ.
df_summary = df[['tax_labels', 'tax']].groupby('tax_labels').sum()
df_summary.plot.bar()
<Axes: xlabel='tax_labels'>
#Khi quen thuộc bạn có thể viết gọn hai câu lệnh lại thành một line như sau:
df[['tax_labels', 'tax']].groupby('tax_labels').sum().plot.bar()
<Axes: xlabel='tax_labels'>
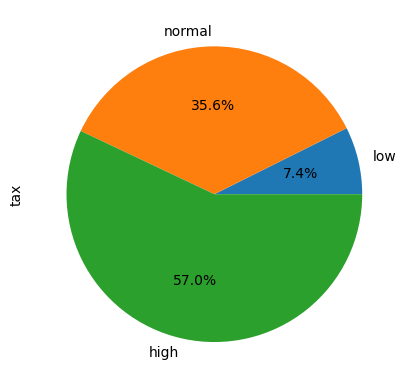
Biểu đồ pie
# 4. Biểu đồ pie
df_summary['tax'].plot.pie(autopct = '%1.1f%%')
<Axes: ylabel='tax'>
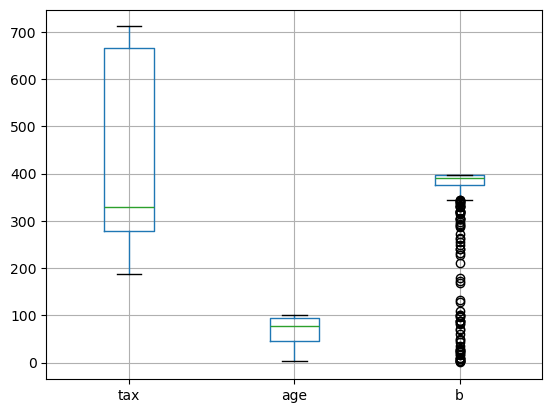
Biểu đồ boxplot
# 5. Biểu đồ boxplot
###Biểu đồ boxplot sẽ được sử dụng để quan sát phân phối của biến đối với các giá trị min, max
###và các ngưỡng phân vị 25%, 50%, 75%. Căn cứ vào boxplot ta có thể biết được khoảng biến thiên của biến rộng hay hẹp
### và biến phân phối lệch trái hay phải.
df[['tax', 'age', 'b']].boxplot()
<Axes: >
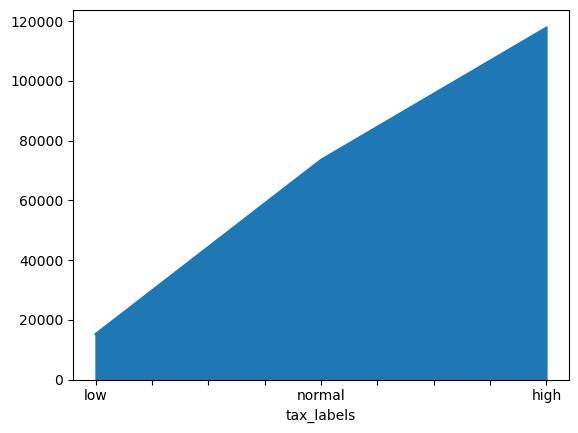
Biểu đồ area
# 6. Biểu đồ area
df_summary['tax'].plot.area()
<Axes: xlabel='tax_labels'>
1.2.1.1.3.3. Reshape dataframe trên pandas#
1.2.1.1.3.3.1. Melt#
Hàm melt là hàm được lấy ý tưởng từ ngôn ngữ R. Hàm này sẽ làm cho bảng của chúng ta trở nên bớt cồng kềnh hơn bằng cách rút gọn nhiều measurements thành hai cột variable và value trong đó cột variable qui định loại measurement và value là giá trị của measurement. Bảng của bạn sẽ có ít cột hơn đáng kể nên trông giống như các cột measurement đang bị tan chảy vậy. Do đó nó có tên gọi là melt
import pandas as pd
df5 = pd.DataFrame({
  'Ho':['Pham','Nguyen'],
  'Ten' :['Cong', 'Dong'],
  'ChieuCao':[170, 175],
  'CanNang':[60, 65],
  'Tuoi': [25, 27],
  'Diem': [8.5, 9.0],
})

df5
| Ho | Ten | ChieuCao | CanNang | Tuoi | Diem | |
|---|---|---|---|---|---|---|
| 0 | Pham | Cong | 170 | 60 | 25 | 8.5 |
| 1 | Nguyen | Dong | 175 | 65 | 27 | 9.0 |
#Ta nhận thấy Ho, Ten là những dimension, bây giờ ta sẽ giữ nguyên những trường này và làm tan chảy các cột.
df5.melt(['Ho', 'Ten'])
#Ta nhận thấy bảng đã trở nên gọn gàng hơn khi các cột được đưa vào trường variable và giá trị của chúng được đưa vào value.
| Ho | Ten | variable | value | |
|---|---|---|---|---|
| 0 | Pham | Cong | ChieuCao | 170.0 |
| 1 | Nguyen | Dong | ChieuCao | 175.0 |
| 2 | Pham | Cong | CanNang | 60.0 |
| 3 | Nguyen | Dong | CanNang | 65.0 |
| 4 | Pham | Cong | Tuoi | 25.0 |
| 5 | Nguyen | Dong | Tuoi | 27.0 |
| 6 | Pham | Cong | Diem | 8.5 |
| 7 | Nguyen | Dong | Diem | 9.0 |
1.2.1.1.3.3.2. Biến đổi Dummy#
### Cách biến đổi dummy là một cách rất hiệu quả để biến đổi một biến category(Loại) thành một one-hot véc tơ.
###Cụ thể cũng với bảng df5 ở trên, ta nhận thấy biến Ho gồm hai giá trị là Pham và Nguyen.
###Chúng ta có thể tạo thành một one-hot vector sao cho nếu giá trị đầu tiên là 0 thì tương ứng với họ Pham
###và giá trị thứ hai là 1 thì họ Nguyen (chưa xét tới trường hợp tồn tại họ khác Pham và Nguyen).
###Thường thì bạn sẽ nghĩ đến sử dụng hàm LabelBinarizer của sklearn nhưng pandas cung cấp
###cho bạn một hàm đơn giản hơn là pd.get_dummies()

import pandas as pd
df5 = pd.DataFrame({
  'Ho':['Pham','Nguyen'],
  'Ten' :['Cong', 'Dong'],
  'ChieuCao':[170, 175],
  'CanNang':[60, 65],
  'Tuoi': [25, 27],
  'Diem': [8.5, 9.0],
})

pd.get_dummies(df5)
| ChieuCao | CanNang | Tuoi | Diem | Ho_Nguyen | Ho_Pham | Ten_Cong | Ten_Dong | |
|---|---|---|---|---|---|---|---|---|
| 0 | 170 | 60 | 25 | 8.5 | False | True | True | False |
| 1 | 175 | 65 | 27 | 9.0 | True | False | False | True |
1.2.1.1.3.4. Thống kê theo nhóm trên pandas (groupby() )#
Hai câu lệnh kinh điển trong pandas được sử dụng nhiều trong thống kê theo nhóm trên pandas đó là df.groupby() và pd.pivotable().
1.2.1.1.3.4.1. df.groupby()#
measurement là những biến có thể cộng trừ nhân chia và đo đếm được.
dimension là những biến dùng để phân nhóm dữ liệu.
Cú pháp của hàm df.groupby() khá đơn giản:
df.groupby(by=None,
….
)
import pandas as pd
df = pd.read_csv("https://raw.githubusercontent.com/phamdinhkhanh/datasets/master/BostonHousing.csv", sep=",", header = 0, index_col = None)
bins = [-999999, 250, 400, 999999]
labels = ['low', 'normal', 'high']
# low: -999999 < 250
# normal: 250 <- 400
# high: 400 <- 999999
df['tax_labels'] = pd.cut(df['tax'], bins=bins, labels=labels)
df.groupby('tax_labels')['tax'].sum()
tax_labels
low        15221
normal     73540
high      117807
Name: tax, dtype: int64
# Nếu muốn sử dụng groupby() cho mọi biến đổi hàm chúng ta có thể dùng hàm lambda trong apply().
df.groupby('tax_labels')['tax'].apply(lambda x: sum(x))
tax_labels
low        15221
normal     73540
high      117807
Name: tax, dtype: int64
# Nếu muốn áp dụng tính toán cho nhiều measurements một lúc thì truyền vào một list các measurements
#Chẳng hạn bên dưới ta truyền vào một list gồm ['tax', 'rm']
import numpy as np
import pandas as pd
df = pd.read_csv("https://raw.githubusercontent.com/phamdinhkhanh/datasets/master/BostonHousing.csv", sep=",", header = 0, index_col = None)
bins = [-999999, 250, 400, 999999]
labels = ['low', 'normal', 'high']
# low: -999999 < 250
# normal: 250 <- 400
# high: 400 <- 999999
df['tax_labels'] = pd.cut(df['tax'], bins=bins, labels=labels)
df.groupby('tax_labels')[['tax', 'rm']].apply(lambda x: np.mean(x))
tax_labels
low       113.559920
normal    158.358051
high      297.537600
dtype: float64
# Tính quantile 90% của mỗi nhóm tax_labels.
def quantile(x):
  q_90 = np.quantile(x, 0.9)
  return q_90

df.groupby('tax_labels')['tax'].apply(lambda x: quantile(x))
tax_labels
low       244.2
normal    384.0
high      666.0
Name: tax, dtype: float64
#Hoặc group theo nhiều chiều dữ liệu. Khi đó phải truyền vào groupby() một list các dimension.
df.groupby(['tax_labels', 'chas'])['tax'].apply(lambda x: quantile(x))
tax_labels  chas
low         0       244.6
            1       223.0
normal      0       384.0
            1       307.0
high        0       666.0
            1       666.0
Name: tax, dtype: float64
Ưu điểm của groupby() đó là nhanh gọn, dễ hiểu. Nhưng nhược điểm của groupby() đó là chúng ta chỉ có thể áp dụng cùng một biến đổi hàm số cho mọi measurements. Ở pivot_table bạn có thể tuỳ biến sâu hơn từng hàm đối với từng measurement nhưng cú pháp sẽ phức tạp hơn một chút.
1.2.1.1.3.4.2. Pivotable#
Pivot table là một công thức có ứng dụng rất quan trọng trong pandas. Nó giúp cho chúng ta thực hiện các thống kê trên các biến measurement theo các chiều dimension. Bạn sẽ hình dung ra cách áp dụng của pivot_table() thông qua ví dụ bên dưới.
import numpy as np

pd.pivot_table(df,
               columns = ['tax_labels', 'chas'],
               index = ['rad'],
               values = 'tax',
  Cell In[58], line 6
    values = 'tax',
                   ^
SyntaxError: incomplete input
Bảng thống kê trên sẽ tính tổng số thuế thu được phân theo các cột là tax_labels và chas(tax_labels gồm low, normal và high và chas gồm 0-không bao bởi sông, 1-bao bởi sông). Các dòng lại được phân nhóm theo chỉ số mức độ tiếp cận đường cao tốc rad gồm các giá trị 1,2,3,4,5,6,7,8,24. Như vậy ta có thể hình dung được trong công thức của pivot_table, các đối số của nó có ý nghĩa như sau:
columns: List các dimensions của cột mà chúng ta cần thống kê.
index: List các dimensions theo dòng mà chúng ta cần thống kê.
values: List các measurement chúng ta sử dụng để tính toán.
aggfunc: Qui định hàm số chúng ta sẽ dùng để biến đổi measurement.
Trong ví dụ này chúng ta áp dụng hàm np.sum cho toán bộ các measurement.
#Làm sao để qui định mỗi measurement một công thức?

#Giả sử chúng ta cần tính thêm trung bình số phòng trên căn hộ.
#Tức là thêm trung bình của trường rm trong khi vẫn cần tính tổng của trường tax.
#Khi đó cần khai báo aggfunc dưới dạng một dictionary có key là tên của measurement và value là công thức của measurement.

pd.pivot_table(df,
               columns = ['tax_labels', 'chas'],
               index = ['rad'],
               values = ['tax', 'rm'],
               aggfunc = {
                   'tax': np.sum,
                   'rm': np.mean
                   })
| rm | tax | |||||||||||
|---|---|---|---|---|---|---|---|---|---|---|---|---|
| tax_labels | low | normal | high | low | normal | high | ||||||
| chas | 0 | 1 | 0 | 1 | 0 | 1 | 0 | 1 | 0 | 1 | 0 | 1 |
| rad | ||||||||||||
| 1 | 6.230000 | 7.9230 | 6.495529 | NaN | 6.540000 | NaN | 241 | 198 | 4968 | 0 | 422 | 0 |
| 2 | 6.086111 | NaN | 6.988267 | NaN | NaN | NaN | 1800 | 0 | 4456 | 0 | 0 | 0 |
| 3 | 6.442586 | 6.8055 | 6.382750 | NaN | 6.666000 | NaN | 6424 | 446 | 1208 | 0 | 1273 | 0 |
| 4 | 6.790333 | NaN | 6.102015 | 6.178750 | 5.966520 | NaN | 2155 | 0 | 20434 | 2147 | 12222 | 0 |
| 5 | 6.462769 | 7.6450 | 6.509221 | 6.070667 | 5.982174 | 6.446143 | 2853 | 216 | 22175 | 828 | 9269 | 2821 |
| 6 | NaN | NaN | 6.118882 | NaN | 6.078000 | NaN | 0 | 0 | 5807 | 0 | 3888 | 0 |
| 7 | 7.030250 | NaN | 6.530077 | NaN | NaN | NaN | 888 | 0 | 4287 | 0 | 0 | 0 |
| 8 | NaN | NaN | 7.024632 | 6.670200 | NaN | NaN | 0 | 0 | 5695 | 1535 | 0 | 0 |
| 24 | NaN | NaN | NaN | NaN | 5.984137 | 6.611375 | 0 | 0 | 0 | 0 | 82584 | 5328 |
1.2.1.1.3.5. Join, Merge và Concatenate bảng#
NỐI , HỢP NHẤT , GHÉP BẢNG
1.2.1.1.3.5.1. Các kiểu join#
Chúng ta có 4 kiểu join chính là left join, right join, inner join, full join
left join: Lấy bảng bên trái làm gốc và đưa thêm thông tin bảng bên phải nếu nó xuất hiện ở bảng bên trái.
right join: Tương tự như left join nhưng bảng bên phải sẽ làm gốc.
inner join: Lấy những thông tin mà xuất hiện đồng thời ở cả hai bảng.
full join: Lấy những thông tin xuất hiện ở một trong hai bảng.
import pandas as pd

df_sinhvien = pd.DataFrame({
    'ID':['001', '002', '003', '004', '005'],
    'Name':['Pham Van Nghia', 'Tong Thuy Linh', 'Le Van Dai', 'Tran Quang Nghia', 'Doan Thu Ha'],
    'Age': [25, 26, 25, 23, 22],
    'Province':['Nam Dinh', 'Thanh Hoa', 'TP Ho Chi Minh', 'Da Nang', 'Can Tho']
})

df_sinhvien
| ID | Name | Age | Province | |
|---|---|---|---|---|
| 0 | 001 | Pham Van Nghia | 25 | Nam Dinh |
| 1 | 002 | Tong Thuy Linh | 26 | Thanh Hoa |
| 2 | 003 | Le Van Dai | 25 | TP Ho Chi Minh |
| 3 | 004 | Tran Quang Nghia | 23 | Da Nang |
| 4 | 005 | Doan Thu Ha | 22 | Can Tho |
df_score = pd.DataFrame({
    'ID': ['001', '002', '003', '006', '007'],
    'Math': [6.75, 9, 8, 7, 10],
    'Physic': [8, 9, 9, 8.5, 9],
    'Chemistry': [7, 9.5, 7.5, 9, 10],
    'Province': ['Nam Dinh', 'Thanh Hoa', 'TP Ho Chi Minh', 'Quang Nam', 'Nghe An']
})

df_score
| ID | Math | Physic | Chemistry | Province | |
|---|---|---|---|---|---|
| 0 | 001 | 6.75 | 8.0 | 7.0 | Nam Dinh |
| 1 | 002 | 9.00 | 9.0 | 9.5 | Thanh Hoa |
| 2 | 003 | 8.00 | 9.0 | 7.5 | TP Ho Chi Minh |
| 3 | 006 | 7.00 | 8.5 | 9.0 | Quang Nam |
| 4 | 007 | 10.00 | 9.0 | 10.0 | Nghe An |
1.2.1.1.3.5.2. Câu lệnh pd.merge()#
Cú pháp chung của câu lện pd.merge() đó là:
pd.merge(
left,
right,
how=”inner”,
on=None,
left_on=None,
right_on=None,
right_index=False,
sort=True,
suffixes=(“_x”, “_y”),
copy=True,
indicator=False,
validate=None,
)
Trong đó một số trường quan trọng:
left: bảng bên trái
right: bảng bên phải
how: Phương pháp join gồm left, right, inner, outer
left_on: Trường ở bảng bên trái sử dụng để join
right_on: Trường ở bảng bên phải sử dụng để join
left_index: Mặc định là False. Nếu True, sử dụng row index ở bảng bên trái như là trường join.
right_index: Mặc định là False. Nếu True, sử dụng row index ở bảng bên phải như là trường join.
suffixes: Nếu hai bảng tồn tại các trường trùng nhau thì sử dụng suffix để phân biệt trường nào thuộc bảng nào.
Mặc định là (‘_x’, ‘_y’).
# inner join: Theo cách này chỉ ID xuất hiện ở đồng thời hai bảng mới được lựa chọn.
pd.merge(df_sinhvien, df_score,
         left_on='ID',
         right_on='ID',
         how='inner',
         suffixes=['_Sv', '_Score'])
| ID | Name | Age | Province_Sv | Math | Physic | Chemistry | Province_Score | |
|---|---|---|---|---|---|---|---|---|
| 0 | 001 | Pham Van Nghia | 25 | Nam Dinh | 6.75 | 8.0 | 7.0 | Nam Dinh |
| 1 | 002 | Tong Thuy Linh | 26 | Thanh Hoa | 9.00 | 9.0 | 9.5 | Thanh Hoa |
| 2 | 003 | Le Van Dai | 25 | TP Ho Chi Minh | 8.00 | 9.0 | 7.5 | TP Ho Chi Minh |
# left join: Những ID xuất hiện ở bảng bên trái sẽ được lựa chọn.
pd.merge(df_sinhvien, df_score,
         left_on='ID',
         right_on='ID',
         how='left',
         suffixes=['_Sv', '_Score'])
| ID | Name | Age | Province_Sv | Math | Physic | Chemistry | Province_Score | |
|---|---|---|---|---|---|---|---|---|
| 0 | 001 | Pham Van Nghia | 25 | Nam Dinh | 6.75 | 8.0 | 7.0 | Nam Dinh |
| 1 | 002 | Tong Thuy Linh | 26 | Thanh Hoa | 9.00 | 9.0 | 9.5 | Thanh Hoa |
| 2 | 003 | Le Van Dai | 25 | TP Ho Chi Minh | 8.00 | 9.0 | 7.5 | TP Ho Chi Minh |
| 3 | 004 | Tran Quang Nghia | 23 | Da Nang | NaN | NaN | NaN | NaN |
| 4 | 005 | Doan Thu Ha | 22 | Can Tho | NaN | NaN | NaN | NaN |
# right join: Những ID xuất hiện ở bảng bên phải sẽ được lựa chọn.
pd.merge(df_sinhvien, df_score,
         left_on='ID',
         right_on='ID',
         how='right',
         suffixes=['_Sv', '_Score'])
| ID | Name | Age | Province_Sv | Math | Physic | Chemistry | Province_Score | |
|---|---|---|---|---|---|---|---|---|
| 0 | 001 | Pham Van Nghia | 25.0 | Nam Dinh | 6.75 | 8.0 | 7.0 | Nam Dinh |
| 1 | 002 | Tong Thuy Linh | 26.0 | Thanh Hoa | 9.00 | 9.0 | 9.5 | Thanh Hoa |
| 2 | 003 | Le Van Dai | 25.0 | TP Ho Chi Minh | 8.00 | 9.0 | 7.5 | TP Ho Chi Minh |
| 3 | 006 | NaN | NaN | NaN | 7.00 | 8.5 | 9.0 | Quang Nam |
| 4 | 007 | NaN | NaN | NaN | 10.00 | 9.0 | 10.0 | Nghe An |
# outer join: Tất cả ID xuất hiện ở bảng bên trái hoặc bảng bên phải sẽ được lựa chọn.
pd.merge(df_sinhvien, df_score,
         left_on='ID',
         right_on='ID',
         how='outer',
         suffixes=['_Sv', '_Score'])
| ID | Name | Age | Province_Sv | Math | Physic | Chemistry | Province_Score | |
|---|---|---|---|---|---|---|---|---|
| 0 | 001 | Pham Van Nghia | 25.0 | Nam Dinh | 6.75 | 8.0 | 7.0 | Nam Dinh |
| 1 | 002 | Tong Thuy Linh | 26.0 | Thanh Hoa | 9.00 | 9.0 | 9.5 | Thanh Hoa |
| 2 | 003 | Le Van Dai | 25.0 | TP Ho Chi Minh | 8.00 | 9.0 | 7.5 | TP Ho Chi Minh |
| 3 | 004 | Tran Quang Nghia | 23.0 | Da Nang | NaN | NaN | NaN | NaN |
| 4 | 005 | Doan Thu Ha | 22.0 | Can Tho | NaN | NaN | NaN | NaN |
| 5 | 006 | NaN | NaN | NaN | 7.00 | 8.5 | 9.0 | Quang Nam |
| 6 | 007 | NaN | NaN | NaN | 10.00 | 9.0 | 10.0 | Nghe An |
1.2.1.1.3.5.3. df.join()#
import pandas as pd

df_sinhvien = pd.DataFrame({
    'ID':['001', '002', '003', '004', '005'],
    'Name':['Pham Van Nghia', 'Tong Thuy Linh', 'Le Van Dai', 'Tran Quang Nghia', 'Doan Thu Ha'],
    'Age': [25, 26, 25, 23, 22],
    'Province':['Nam Dinh', 'Thanh Hoa', 'TP Ho Chi Minh', 'Da Nang', 'Can Tho']
})

df_sinhvien
| ID | Name | Age | Province | |
|---|---|---|---|---|
| 0 | 001 | Pham Van Nghia | 25 | Nam Dinh |
| 1 | 002 | Tong Thuy Linh | 26 | Thanh Hoa |
| 2 | 003 | Le Van Dai | 25 | TP Ho Chi Minh |
| 3 | 004 | Tran Quang Nghia | 23 | Da Nang |
| 4 | 005 | Doan Thu Ha | 22 | Can Tho |
df_score = pd.DataFrame({
    'ID': ['001', '002', '003', '006', '007'],
    'Math': [6.75, 9, 8, 7, 10],
    'Physic': [8, 9, 9, 8.5, 9],
    'Chemistry': [7, 9.5, 7.5, 9, 10],
    'Province': ['Nam Dinh', 'Thanh Hoa', 'TP Ho Chi Minh', 'Quang Nam', 'Nghe An']
})

df_score
| ID | Math | Physic | Chemistry | Province | |
|---|---|---|---|---|---|
| 0 | 001 | 6.75 | 8.0 | 7.0 | Nam Dinh |
| 1 | 002 | 9.00 | 9.0 | 9.5 | Thanh Hoa |
| 2 | 003 | 8.00 | 9.0 | 7.5 | TP Ho Chi Minh |
| 3 | 006 | 7.00 | 8.5 | 9.0 | Quang Nam |
| 4 | 007 | 10.00 | 9.0 | 10.0 | Nghe An |
DataFrame có một hàm là hàm join() có chức năng tương đương với merge, dùng để liên kết bảng theo các keys.
df_sinhvien.join(df_score, lsuffix='_Sv', rsuffix='_Score')
| ID_Sv | Name | Age | Province_Sv | ID_Score | Math | Physic | Chemistry | Province_Score | |
|---|---|---|---|---|---|---|---|---|---|
| 0 | 001 | Pham Van Nghia | 25 | Nam Dinh | 001 | 6.75 | 8.0 | 7.0 | Nam Dinh |
| 1 | 002 | Tong Thuy Linh | 26 | Thanh Hoa | 002 | 9.00 | 9.0 | 9.5 | Thanh Hoa |
| 2 | 003 | Le Van Dai | 25 | TP Ho Chi Minh | 003 | 8.00 | 9.0 | 7.5 | TP Ho Chi Minh |
| 3 | 004 | Tran Quang Nghia | 23 | Da Nang | 006 | 7.00 | 8.5 | 9.0 | Quang Nam |
| 4 | 005 | Doan Thu Ha | 22 | Can Tho | 007 | 10.00 | 9.0 | 10.0 | Nghe An |
Mặc định bảng sẽ join theo index của dòng, các đối số lsuffixvàrsuffix`
lần lượt được sử dụng để qui định hậu tố (suffix) cho bảng bên trái và bảng bên phải nếu xuất hiện trường trùng tên.
#Nếu muốn thực hiện hàm join() theo một trường nào đó, chúng ta phải thiết lập index cho bảng là trường cần join
#rồi sau đó mới thực hiện join.
#Ví dụ bạn cần join theo ID:

import pandas as pd

df_sinhvien = pd.DataFrame({
    'ID':['001', '002', '003', '004', '005'],
    'Name':['Pham Van Nghia', 'Tong Thuy Linh', 'Le Van Dai', 'Tran Quang Nghia', 'Doan Thu Ha'],
    'Age': [25, 26, 25, 23, 22],
    'Province':['Nam Dinh', 'Thanh Hoa', 'TP Ho Chi Minh', 'Da Nang', 'Can Tho']
})

df_score = pd.DataFrame({
    'ID': ['001', '002', '003', '006', '007'],
    'Math': [6.75, 9, 8, 7, 10],
    'Physic': [8, 9, 9, 8.5, 9],
    'Chemistry': [7, 9.5, 7.5, 9, 10],
    'Province': ['Nam Dinh', 'Thanh Hoa', 'TP Ho Chi Minh', 'Quang Nam', 'Nghe An']
})
# Thiết lập index
df_sinhvien.set_index('ID', inplace = True)
df_score.set_index('ID', inplace = True)

# Join bảng
df_sinhvien.join(df_score, lsuffix='_Sv', rsuffix='_Score')
| Name | Age | Province_Sv | Math | Physic | Chemistry | Province_Score | |
|---|---|---|---|---|---|---|---|
| ID | |||||||
| 001 | Pham Van Nghia | 25 | Nam Dinh | 6.75 | 8.0 | 7.0 | Nam Dinh |
| 002 | Tong Thuy Linh | 26 | Thanh Hoa | 9.00 | 9.0 | 9.5 | Thanh Hoa |
| 003 | Le Van Dai | 25 | TP Ho Chi Minh | 8.00 | 9.0 | 7.5 | TP Ho Chi Minh |
| 004 | Tran Quang Nghia | 23 | Da Nang | NaN | NaN | NaN | NaN |
| 005 | Doan Thu Ha | 22 | Can Tho | NaN | NaN | NaN | NaN |
reset lại index
df_sinhvien.reset_index('ID', inplace = True)df_score.reset_index('ID', inplace = True)
1.2.1.1.3.5.4. Câu lệnh pd.concat()#
Câu lệnh pd.concat() được sử dụng để nối hai bảng theo dòng hoặc theo cột
Một ví dụ khá cụ thể đó là trong package vnquant dữ liệu mỗi mã chứng khoán sẽ bị phân trang. Nếu download lần lượt trừng trang thì sẽ lâu, do đó để tăng tốc thì chúng ta sẽ download song song nhiều trang một lúc và sử dụng lệnh pd.concat() để nối dữ liệu thành một bảng chính.
Cú pháp chung của lệnh pd.concat() sẽ như sau:
pd.concat(
objs,
axis=0,
join=’outer’,
ignore_index=False,
keys=None,
levels=None,
names=None,
verify_integrity=False,
sort=False,
copy=True
)
objs: Là list các bảng cần concanate(nốt tiếp).
axis: Mặc đinh là 0, nối theo dòng. Trái lại là 1 nếu nối theo cột.
join: inner chỉ lấy các dòng hoặc cột có cùng index; outer lấy cả các dòng hoặc cột khác index.
#Nếu chúng ta muốn nối hai bảng theo dòng và chỉ lấy trường thông tin mà cả hai bảng đều có thì cần thiết lập join='inner'.
import pandas as pd
df_sinhvien = pd.DataFrame({
    'ID':['001', '002', '003', '004', '005'],
    'Name':['Pham Van Nghia', 'Tong Thuy Linh', 'Le Van Dai', 'Tran Quang Nghia', 'Doan Thu Ha'],
    'Age': [25, 26, 25, 23, 22],
    'Province':['Nam Dinh', 'Thanh Hoa', 'TP Ho Chi Minh', 'Da Nang', 'Can Tho']
})
df_score = pd.DataFrame({
    'ID': ['001', '002', '003', '006', '007'],
    'Math': [6.75, 9, 8, 7, 10],
    'Physic': [8, 9, 9, 8.5, 9],
    'Chemistry': [7, 9.5, 7.5, 9, 10],
    'Province': ['Nam Dinh', 'Thanh Hoa', 'TP Ho Chi Minh', 'Quang Nam', 'Nghe An']
})
pd.concat([df_sinhvien, df_score],
          axis=0,
          join='inner')
| ID | Province | |
|---|---|---|
| 0 | 001 | Nam Dinh |
| 1 | 002 | Thanh Hoa |
| 2 | 003 | TP Ho Chi Minh |
| 3 | 004 | Da Nang |
| 4 | 005 | Can Tho |
| 0 | 001 | Nam Dinh |
| 1 | 002 | Thanh Hoa |
| 2 | 003 | TP Ho Chi Minh |
| 3 | 006 | Quang Nam |
| 4 | 007 | Nghe An |
#Ta cũng có thể nối hai bảng theo dòng và lấy tất cả các trường thông tin ở cả hai bảng thì sẽ thiết lập join='outer'
pd.concat([df_sinhvien, df_score],
          axis=0,
          join='outer')
| ID | Name | Age | Province | Math | Physic | Chemistry | |
|---|---|---|---|---|---|---|---|
| 0 | 001 | Pham Van Nghia | 25.0 | Nam Dinh | NaN | NaN | NaN |
| 1 | 002 | Tong Thuy Linh | 26.0 | Thanh Hoa | NaN | NaN | NaN |
| 2 | 003 | Le Van Dai | 25.0 | TP Ho Chi Minh | NaN | NaN | NaN |
| 3 | 004 | Tran Quang Nghia | 23.0 | Da Nang | NaN | NaN | NaN |
| 4 | 005 | Doan Thu Ha | 22.0 | Can Tho | NaN | NaN | NaN |
| 0 | 001 | NaN | NaN | Nam Dinh | 6.75 | 8.0 | 7.0 |
| 1 | 002 | NaN | NaN | Thanh Hoa | 9.00 | 9.0 | 9.5 |
| 2 | 003 | NaN | NaN | TP Ho Chi Minh | 8.00 | 9.0 | 7.5 |
| 3 | 006 | NaN | NaN | Quang Nam | 7.00 | 8.5 | 9.0 |
| 4 | 007 | NaN | NaN | Nghe An | 10.00 | 9.0 | 10.0 |
# Để nối theo cột thì khai báo axis=1.
pd.concat([df_sinhvien, df_score],
          axis=1)
| ID | Name | Age | Province | ID | Math | Physic | Chemistry | Province | |
|---|---|---|---|---|---|---|---|---|---|
| 0 | 001 | Pham Van Nghia | 25 | Nam Dinh | 001 | 6.75 | 8.0 | 7.0 | Nam Dinh |
| 1 | 002 | Tong Thuy Linh | 26 | Thanh Hoa | 002 | 9.00 | 9.0 | 9.5 | Thanh Hoa |
| 2 | 003 | Le Van Dai | 25 | TP Ho Chi Minh | 003 | 8.00 | 9.0 | 7.5 | TP Ho Chi Minh |
| 3 | 004 | Tran Quang Nghia | 23 | Da Nang | 006 | 7.00 | 8.5 | 9.0 | Quang Nam |
| 4 | 005 | Doan Thu Ha | 22 | Can Tho | 007 | 10.00 | 9.0 | 10.0 | Nghe An |
#Khi đó các dòng sẽ được liên kết theo row index ở mỗi bảng.
#Nếu chúng ta muốn các dòng được liên kết theo một trường nào đó như ‘ID’ thì cần set_index() là trường đó trước khi nối.
pd.concat([df_sinhvien.set_index('ID'), df_score.set_index('ID')],
          axis=1)
| Name | Age | Province | Math | Physic | Chemistry | Province | |
|---|---|---|---|---|---|---|---|
| ID | |||||||
| 001 | Pham Van Nghia | 25.0 | Nam Dinh | 6.75 | 8.0 | 7.0 | Nam Dinh |
| 002 | Tong Thuy Linh | 26.0 | Thanh Hoa | 9.00 | 9.0 | 9.5 | Thanh Hoa |
| 003 | Le Van Dai | 25.0 | TP Ho Chi Minh | 8.00 | 9.0 | 7.5 | TP Ho Chi Minh |
| 004 | Tran Quang Nghia | 23.0 | Da Nang | NaN | NaN | NaN | NaN |
| 005 | Doan Thu Ha | 22.0 | Can Tho | NaN | NaN | NaN | NaN |
| 006 | NaN | NaN | NaN | 7.00 | 8.5 | 9.0 | Quang Nam |
| 007 | NaN | NaN | NaN | 10.00 | 9.0 | 10.0 | Nghe An |
pd.concat([df_sinhvien, df_score],
          axis=1,
          join='inner')
| ID | Name | Age | Province | ID | Math | Physic | Chemistry | Province | |
|---|---|---|---|---|---|---|---|---|---|
| 0 | 001 | Pham Van Nghia | 25 | Nam Dinh | 001 | 6.75 | 8.0 | 7.0 | Nam Dinh |
| 1 | 002 | Tong Thuy Linh | 26 | Thanh Hoa | 002 | 9.00 | 9.0 | 9.5 | Thanh Hoa |
| 2 | 003 | Le Van Dai | 25 | TP Ho Chi Minh | 003 | 8.00 | 9.0 | 7.5 | TP Ho Chi Minh |
| 3 | 004 | Tran Quang Nghia | 23 | Da Nang | 006 | 7.00 | 8.5 | 9.0 | Quang Nam |
| 4 | 005 | Doan Thu Ha | 22 | Can Tho | 007 | 10.00 | 9.0 | 10.0 | Nghe An |
1.2.1.1.3.5.5. append()#
Ngoài câu lệnh pd.concat() thì bản thân một dataframe cũng có hàm append() được sử dụng để nối bảng Theo dòng.
import pandas as pd
df_sinhvien = pd.DataFrame({
    'ID':['001', '002', '003', '004', '005'],
    'Name':['Pham Van Nghia', 'Tong Thuy Linh', 'Le Van Dai', 'Tran Quang Nghia', 'Doan Thu Ha'],
    'Age': [25, 26, 25, 23, 22],
    'Province':['Nam Dinh', 'Thanh Hoa', 'TP Ho Chi Minh', 'Da Nang', 'Can Tho']
})
df_score = pd.DataFrame({
    'ID': ['001', '002', '003', '006', '007'],
    'Math': [6.75, 9, 8, 7, 10],
    'Physic': [8, 9, 9, 8.5, 9],
    'Chemistry': [7, 9.5, 7.5, 9, 10],
    'Province': ['Nam Dinh', 'Thanh Hoa', 'TP Ho Chi Minh', 'Quang Nam', 'Nghe An']
})
df_sinhvien.append(df_score)
| ID | Name | Age | Province | Math | Physic | Chemistry | |
|---|---|---|---|---|---|---|---|
| 0 | 001 | Pham Van Nghia | 25.0 | Nam Dinh | NaN | NaN | NaN |
| 1 | 002 | Tong Thuy Linh | 26.0 | Thanh Hoa | NaN | NaN | NaN |
| 2 | 003 | Le Van Dai | 25.0 | TP Ho Chi Minh | NaN | NaN | NaN |
| 3 | 004 | Tran Quang Nghia | 23.0 | Da Nang | NaN | NaN | NaN |
| 4 | 005 | Doan Thu Ha | 22.0 | Can Tho | NaN | NaN | NaN |
| 0 | 001 | NaN | NaN | Nam Dinh | 6.75 | 8.0 | 7.0 |
| 1 | 002 | NaN | NaN | Thanh Hoa | 9.00 | 9.0 | 9.5 |
| 2 | 003 | NaN | NaN | TP Ho Chi Minh | 8.00 | 9.0 | 7.5 |
| 3 | 006 | NaN | NaN | Quang Nam | 7.00 | 8.5 | 9.0 |
| 4 | 007 | NaN | NaN | Nghe An | 10.00 | 9.0 | 10.0 |
#Câu lệnh này sẽ thường được sử dụng trong tình huống bạn muốn tạo bảng tổng hợp từ nhiều bảng con có cùng cấu trúc.
#Ví dụ: Bạn muốn tạo ra một bảng về lợi tức chứng khoán của toàn bộ các ngành từ số liệu chứng khoán của từng ngành.

import numpy as np
import random
import string

df_chungkhoan = pd.DataFrame(columns = ['Nganh', 'Interest'])

for i in range(5):
  r = np.random.uniform(-0.01, 0.01)
  nganh = random.choice(string.ascii_lowercase)
  df_sector = pd.DataFrame({'Nganh': [nganh], 'Interest': [r]}, index=[i])
  df_chungkhoan = df_chungkhoan.append(df_sector)

df_chungkhoan
| Nganh | Interest | |
|---|---|---|
| 0 | l | -0.000582 |
| 1 | f | -0.008874 |
| 2 | k | 0.001311 |
| 3 | z | -0.002288 |
| 4 | h | -0.008648 |
1.2.1.1.3.6. Locate Row (xác định vị trí hàng)#
[] là sử dụng dataFrames
sử dụng loc[] thuộc tính để trả về một hoặc nhiều hàng được chỉ định.
Name là vị trí mà log[] lấy.
import pandas as pd
data = {"calories": [420, 380, 390], "duration": [50, 40, 45]}
#load data into a DataFrame object:
df = pd.DataFrame(data)
print(df.loc[0])
calories    420
duration     50
Name: 0, dtype: int64
print(df.loc[0][0])
print(df.loc[0][1])
### lấy hàng 0 và vị trí thứ 0 hoặc 1
420
50
print(df.loc[[0, 1, 2]]) ### lấy cả 3 hàng

print(df.loc[[0, 1]]) ### lấy hàng 0 và 1
   calories  duration
0       420        50
1       380        40
2       390        45
   calories  duration
0       420        50
1       380        40
1.2.1.1.3.7. Named Indexes (đặt tên cho hàng)#
import pandas as pd
data = { "calories": [420, 380, 390], "duration": [50, 40, 45] }
df = pd.DataFrame(data, index = ["day1", "day2", "day3"])
print(df)
      calories  duration
day1       420        50
day2       380        40
day3       390        45
print(df.loc['day2'])
calories    380
duration     40
Name: day2, dtype: int64
Nếu tập dữ liệu của bạn được lưu trữ trong một tệp, Pandas có thể tải chúng vào DataFrame.
1.2.1.1.4. Pandas Read File (đọc các file của pandas)#
1.2.1.1.4.1. Read datasets#
# from dataprep.eda import create_report
# from dask import dataframe as dd
# import all necessary library
import pandas as pd
import numpy as np
import matplotlib.pyplot as plt

from pyspark.sql import SparkSession
from pyspark.sql import functions as F
from pyspark.sql import SQLContext
from pyspark.sql.types import *
# all type of read data
# data = pd.read_excel(r"<tên file>.xlsx");
#         = pd.read_csv(r"<tên file>.csv"); .....
# còn nhiều cái nữa....
import pandas as pd

df = pd.read_csv('data.csv')

print(df.to_string())
   Unnamed: 0     contents                              infos  numbers
0           0       Author                    Pham Dinh Khanh     1993
1           1         Book          ML algorithms to Practice     2021
2           2       Target  Vi mot cong dong AI vung manh hon        1
3           3  No_Donation                          Community        2
1.2.1.1.4.2. Read file use code SQL by pandas in python#
#Ví dụ về đọc file bằng code SQL trong python
# df = pd.read_sql_query('select * from VMGLEAD_SYNC where RISK_SCORE > 400 ', conn)
1.2.1.1.4.3. Change str to date time in pandas of read_csv#
def read_nav(path = 'Data/nav.csv', nrows = None):
    dtypes = {'PROC_DATE':str,'SUB_ACNT_NO':str, 'NAV':int}
    data2 = pd.read_csv(path,
                    dtype = dtypes,
                    nrows=nrows)
    for col in data2:
        ## đây là lệnh chueyern đổi sang date time khi ta muốn chuyển từ str sang date ngay từ lúc read csv
        data2['PROC_DATE'] = pd.to_datetime(data2['PROC_DATE'])
    return data2
nav = read_nav()
Mẹo: sử dụng to_string()để in toàn bộ DataFrame.
Nếu bạn có DataFrame lớn có nhiều hàng, Pandas sẽ chỉ trả về 5 hàng đầu tiên và 5 hàng cuối cùng.
1.2.1.1.4.4. max_rows (giới hạn)#
kiểm tra số hàng tối đa của hệ thống bằng pd.options.display.max_rowscâu lệnh.
import pandas as pd

print(pd.options.display.max_rows)
60
tăng giới hạn câu lệnh tối đa
import pandas as pd

pd.options.display.max_rows = 9999

df = pd.read_csv('data.csv')

print(df)
   Unnamed: 0     contents                              infos  numbers
0           0       Author                    Pham Dinh Khanh     1993
1           1         Book          ML algorithms to Practice     2021
2           2       Target  Vi mot cong dong AI vung manh hon        1
3           3  No_Donation                          Community        2
1.2.1.1.5. Pandas Read JSON (đọc Json)#
JSON là văn bản thuần túy, nhưng có định dạng của một đối tượng và nổi tiếng trong thế giới lập trình. Các tập dữ liệu lớn thường được lưu trữ hoặc trích xuất dưới dạng JSON.
import pandas as pd

df = pd.read_json('data.json')

print(df.to_string())
---------------------------------------------------------------------------
FileNotFoundError                         Traceback (most recent call last)
Cell In[95], line 3
      1 import pandas as pd
----> 3 df = pd.read_json('data.json')
      5 print(df.to_string())

File ~\anaconda3\Lib\site-packages\pandas\util\_decorators.py:211, in deprecate_kwarg.<locals>._deprecate_kwarg.<locals>.wrapper(*args, **kwargs)
    209     else:
    210         kwargs[new_arg_name] = new_arg_value
--> 211 return func(*args, **kwargs)

File ~\anaconda3\Lib\site-packages\pandas\util\_decorators.py:331, in deprecate_nonkeyword_arguments.<locals>.decorate.<locals>.wrapper(*args, **kwargs)
    325 if len(args) > num_allow_args:
    326     warnings.warn(
    327         msg.format(arguments=_format_argument_list(allow_args)),
    328         FutureWarning,
    329         stacklevel=find_stack_level(),
    330     )
--> 331 return func(*args, **kwargs)

File ~\anaconda3\Lib\site-packages\pandas\io\json\_json.py:733, in read_json(path_or_buf, orient, typ, dtype, convert_axes, convert_dates, keep_default_dates, numpy, precise_float, date_unit, encoding, encoding_errors, lines, chunksize, compression, nrows, storage_options)
    730 if convert_axes is None and orient != "table":
    731     convert_axes = True
--> 733 json_reader = JsonReader(
    734     path_or_buf,
    735     orient=orient,
    736     typ=typ,
    737     dtype=dtype,
    738     convert_axes=convert_axes,
    739     convert_dates=convert_dates,
    740     keep_default_dates=keep_default_dates,
    741     numpy=numpy,
    742     precise_float=precise_float,
    743     date_unit=date_unit,
    744     encoding=encoding,
    745     lines=lines,
    746     chunksize=chunksize,
    747     compression=compression,
    748     nrows=nrows,
    749     storage_options=storage_options,
    750     encoding_errors=encoding_errors,
    751 )
    753 if chunksize:
    754     return json_reader

File ~\anaconda3\Lib\site-packages\pandas\io\json\_json.py:818, in JsonReader.__init__(self, filepath_or_buffer, orient, typ, dtype, convert_axes, convert_dates, keep_default_dates, numpy, precise_float, date_unit, encoding, lines, chunksize, compression, nrows, storage_options, encoding_errors)
    815     if not self.lines:
    816         raise ValueError("nrows can only be passed if lines=True")
--> 818 data = self._get_data_from_filepath(filepath_or_buffer)
    819 self.data = self._preprocess_data(data)

File ~\anaconda3\Lib\site-packages\pandas\io\json\_json.py:874, in JsonReader._get_data_from_filepath(self, filepath_or_buffer)
    866     filepath_or_buffer = self.handles.handle
    867 elif (
    868     isinstance(filepath_or_buffer, str)
    869     and filepath_or_buffer.lower().endswith(
   (...)
    872     and not file_exists(filepath_or_buffer)
    873 ):
--> 874     raise FileNotFoundError(f"File {filepath_or_buffer} does not exist")
    876 return filepath_or_buffer

FileNotFoundError: File data.json does not exist
JSON = Từ điển Python. Các đối tượng JSON có định dạng giống như từ điển Python. Nếu mã JSON của bạn không có trong tệp mà nằm trong Từ điển Python, bạn có thể tải trực tiếp mã đó vào DataFrame. Tải từ điển Python vào DataFrame:
import pandas as pd

data = {"Duration":{"0":60, "1":60, "2":60, "3":45, "4":45, "5":60},
        "Pulse":{"0":110, "1":117, "2":103, "3":109, "4":117, "5":102},
        "Maxpulse":{"0":130, "1":145, "2":135, "3":175, "4":148, "5":127},
        "Calories":{"0":409, "1":479, "2":340, "3":282, "4":406, "5":300}}
df = pd.DataFrame(data)
print(df)
   Duration  Pulse  Maxpulse  Calories
0        60    110       130       409
1        60    117       145       479
2        60    103       135       340
3        45    109       175       282
4        45    117       148       406
5        60    102       127       300
1.2.1.1.6. Pandas - Analyzing DataFrames (Pandas - Phân tích DataFrames)#
1.2.1.1.6.1. Viewing the Data (xem dữ liệu được chỉ định)#
Phương thức head() là phương thức trả về các tiêu đề và số hàng được chỉ định, bắt đầu từ trên cùng.
VD bằng cách in 10 hàng đầu tiên của DataFrame.
import pandas as pd

df = pd.read_csv('data.csv')

print(df.head())
   Unnamed: 0     contents                              infos  numbers
0           0       Author                    Pham Dinh Khanh     1993
1           1         Book          ML algorithms to Practice     2021
2           2       Target  Vi mot cong dong AI vung manh hon        1
3           3  No_Donation                          Community        2
Nếu số lượng hàng không được chỉ định, head() phương thức sẽ trả về 5 hàng trên cùng.
import pandas as pd
df = pd.read_csv('data.csv')
print(df.head(10))
   Unnamed: 0     contents                              infos  numbers
0           0       Author                    Pham Dinh Khanh     1993
1           1         Book          ML algorithms to Practice     2021
2           2       Target  Vi mot cong dong AI vung manh hon        1
3           3  No_Donation                          Community        2
phương thức tail() là phương thức trả về các tiêu đề và số hàng được chỉ định, bắt đầu từ dưới cùng.
print(df.tail()) ### k có gì tỏng tail() thì mặc định là 5 hàng cuối cùng từ dưới lên.
   Unnamed: 0     contents                              infos  numbers
0           0       Author                    Pham Dinh Khanh     1993
1           1         Book          ML algorithms to Practice     2021
2           2       Target  Vi mot cong dong AI vung manh hon        1
3           3  No_Donation                          Community        2
print(df.tail(2))
   Unnamed: 0     contents                              infos  numbers
2           2       Target  Vi mot cong dong AI vung manh hon        1
3           3  No_Donation                          Community        2
1.2.1.1.6.2. Info About the Data (thông tin về dữ liệu)#
câu lệnh info() cung cấp thêm thông tin về tập dữ liệu.
print(df.info())
<class 'pandas.core.frame.DataFrame'>
RangeIndex: 4 entries, 0 to 3
Data columns (total 4 columns):
 #   Column      Non-Null Count  Dtype
---  ------      --------------  -----
 0   Unnamed: 0  4 non-null      int64
 1   contents    4 non-null      object
 2   infos       4 non-null      object
 3   numbers     4 non-null      int64
dtypes: int64(2), object(2)
memory usage: 260.0+ bytes
None
1.2.1.2. Pandas Cleaning data (Làm sạch dữ liệu)#
1.2.1.2.1. Pandas - Cleaning Empty Cells (Dọn dẹp ô trống)#
kiểu sửa dữ liệu VD như Ô trống, Dữ liệu sai định dạng, Dữ liệu sai, trùng lặp
1.2.1.2.1.1. Remove Rows (xóa hàng)#
Trả về Khung dữ liệu mới không có ô trống.
Lưu ý: Theo mặc định, dropna() phương thức trả về DataFrame mới và sẽ không thay đổi bản gốc:
import pandas as pd

df = pd.read_csv('data.csv')

new_df = df.dropna()

print(new_df.to_string())
   Unnamed: 0     contents                              infos  numbers
0           0       Author                    Pham Dinh Khanh     1993
1           1         Book          ML algorithms to Practice     2021
2           2       Target  Vi mot cong dong AI vung manh hon        1
3           3  No_Donation                          Community        2
Nếu bạn muốn thay đổi DataFrame gốc, hãy sử dụng inplace = True đối số:
Xóa tất cả các hàng có giá trị NULL:
Lưu ý: Bây giờ, nó dropna(inplace = True)sẽ KHÔNG trả về DataFrame mới nhưng sẽ xóa tất cả các hàng chứa giá trị NULL khỏi DataFrame gốc.
import pandas as pd

df = pd.read_csv('data.csv')

df.dropna(inplace = True)

print(df.to_string())
   Unnamed: 0     contents                              infos  numbers
0           0       Author                    Pham Dinh Khanh     1993
1           1         Book          ML algorithms to Practice     2021
2           2       Target  Vi mot cong dong AI vung manh hon        1
3           3  No_Donation                          Community        2
1.2.1.2.1.2. Replace Empty Values (Thay thế các giá trị trống)#
k cần phải xóa hàng ta chỉ cần thay ô trống bằng 1 giá trị hoặc bla…Phương thức fillna()cho phép chúng ta thay thế các ô trống bằng một giá trị.
VD Thay thế giá trị NULL bằng số 130:
fillna : là điền vào
import pandas as pd

df = pd.read_csv('data.csv')

df.fillna(130, inplace = True)
print(df)
   Unnamed: 0     contents                              infos  numbers
0           0       Author                    Pham Dinh Khanh     1993
1           1         Book          ML algorithms to Practice     2021
2           2       Target  Vi mot cong dong AI vung manh hon        1
3           3  No_Donation                          Community        2
1.2.1.2.1.3. Replace Only For Specified Columns (Chỉ thay thế cho các cột được chỉ định)#
Để chỉ thay thế các giá trị trống cho một cột, hãy chỉ định tên cột cho DataFrame.
Ví dụ Thay thế giá trị NULL trong cột “Calories” bằng số 130.
fillna : là điền vào
import pandas as pd

df = pd.read_csv('data.csv')

df["Calories"].fillna(130, inplace = True)
---------------------------------------------------------------------------
KeyError                                  Traceback (most recent call last)
File ~\anaconda3\Lib\site-packages\pandas\core\indexes\base.py:3802, in Index.get_loc(self, key, method, tolerance)
   3801 try:
-> 3802     return self._engine.get_loc(casted_key)
   3803 except KeyError as err:

File ~\anaconda3\Lib\site-packages\pandas\_libs\index.pyx:138, in pandas._libs.index.IndexEngine.get_loc()

File ~\anaconda3\Lib\site-packages\pandas\_libs\index.pyx:165, in pandas._libs.index.IndexEngine.get_loc()

File pandas\_libs\hashtable_class_helper.pxi:5745, in pandas._libs.hashtable.PyObjectHashTable.get_item()

File pandas\_libs\hashtable_class_helper.pxi:5753, in pandas._libs.hashtable.PyObjectHashTable.get_item()

KeyError: 'Calories'

The above exception was the direct cause of the following exception:

KeyError                                  Traceback (most recent call last)
Cell In[109], line 5
      1 import pandas as pd
      3 df = pd.read_csv('data.csv')
----> 5 df["Calories"].fillna(130, inplace = True)

File ~\anaconda3\Lib\site-packages\pandas\core\frame.py:3807, in DataFrame.__getitem__(self, key)
   3805 if self.columns.nlevels > 1:
   3806     return self._getitem_multilevel(key)
-> 3807 indexer = self.columns.get_loc(key)
   3808 if is_integer(indexer):
   3809     indexer = [indexer]

File ~\anaconda3\Lib\site-packages\pandas\core\indexes\base.py:3804, in Index.get_loc(self, key, method, tolerance)
   3802     return self._engine.get_loc(casted_key)
   3803 except KeyError as err:
-> 3804     raise KeyError(key) from err
   3805 except TypeError:
   3806     # If we have a listlike key, _check_indexing_error will raise
   3807     #  InvalidIndexError. Otherwise we fall through and re-raise
   3808     #  the TypeError.
   3809     self._check_indexing_error(key)

KeyError: 'Calories'
1.2.1.2.1.4. Replace Using Mean, Median, or Mode (Thay thế bằng cách sử dụng giá trị trung bình, trung vị hoặc chế độ)#
Một cách phổ biến để thay thế các ô trống là tính giá trị trung bình, trung vị hoặc chế độ của cột.
Pandas sử dụng các phương thức mean() median()và mode()để tính toán các giá trị tương ứng cho một cột được chỉ định:
VD Tính MEAN và thay thế bất kỳ giá trị trống nào bằng nó:
mean trung bình
median trung vị
mode chế độ
fillna : là điền vào
import pandas as pd

df = pd.read_csv('data.csv')

x = df["Calories"].mean()

df["Calories"].fillna(x, inplace = True)
---------------------------------------------------------------------------
KeyError                                  Traceback (most recent call last)
File ~\anaconda3\Lib\site-packages\pandas\core\indexes\base.py:3802, in Index.get_loc(self, key, method, tolerance)
   3801 try:
-> 3802     return self._engine.get_loc(casted_key)
   3803 except KeyError as err:

File ~\anaconda3\Lib\site-packages\pandas\_libs\index.pyx:138, in pandas._libs.index.IndexEngine.get_loc()

File ~\anaconda3\Lib\site-packages\pandas\_libs\index.pyx:165, in pandas._libs.index.IndexEngine.get_loc()

File pandas\_libs\hashtable_class_helper.pxi:5745, in pandas._libs.hashtable.PyObjectHashTable.get_item()

File pandas\_libs\hashtable_class_helper.pxi:5753, in pandas._libs.hashtable.PyObjectHashTable.get_item()

KeyError: 'Calories'

The above exception was the direct cause of the following exception:

KeyError                                  Traceback (most recent call last)
Cell In[112], line 5
      1 import pandas as pd
      3 df = pd.read_csv('data.csv')
----> 5 x = df["Calories"].mean()
      7 df["Calories"].fillna(x, inplace = True)

File ~\anaconda3\Lib\site-packages\pandas\core\frame.py:3807, in DataFrame.__getitem__(self, key)
   3805 if self.columns.nlevels > 1:
   3806     return self._getitem_multilevel(key)
-> 3807 indexer = self.columns.get_loc(key)
   3808 if is_integer(indexer):
   3809     indexer = [indexer]

File ~\anaconda3\Lib\site-packages\pandas\core\indexes\base.py:3804, in Index.get_loc(self, key, method, tolerance)
   3802     return self._engine.get_loc(casted_key)
   3803 except KeyError as err:
-> 3804     raise KeyError(key) from err
   3805 except TypeError:
   3806     # If we have a listlike key, _check_indexing_error will raise
   3807     #  InvalidIndexError. Otherwise we fall through and re-raise
   3808     #  the TypeError.
   3809     self._check_indexing_error(key)

KeyError: 'Calories'
###Ví dụ
###Tính toán MEDIAN và thay thế bất kỳ giá trị trống nào bằng nó:
### median : trung vị, Trung vị = giá trị ở giữa, sau khi bạn đã sắp xếp tất cả các giá trị tăng dần.
import pandas as pd

df = pd.read_csv('data.csv')

x = df["Calories"].median()

df["Calories"].fillna(x, inplace = True)
---------------------------------------------------------------------------
KeyError                                  Traceback (most recent call last)
File ~\anaconda3\Lib\site-packages\pandas\core\indexes\base.py:3802, in Index.get_loc(self, key, method, tolerance)
   3801 try:
-> 3802     return self._engine.get_loc(casted_key)
   3803 except KeyError as err:

File ~\anaconda3\Lib\site-packages\pandas\_libs\index.pyx:138, in pandas._libs.index.IndexEngine.get_loc()

File ~\anaconda3\Lib\site-packages\pandas\_libs\index.pyx:165, in pandas._libs.index.IndexEngine.get_loc()

File pandas\_libs\hashtable_class_helper.pxi:5745, in pandas._libs.hashtable.PyObjectHashTable.get_item()

File pandas\_libs\hashtable_class_helper.pxi:5753, in pandas._libs.hashtable.PyObjectHashTable.get_item()

KeyError: 'Calories'

The above exception was the direct cause of the following exception:

KeyError                                  Traceback (most recent call last)
Cell In[113], line 8
      4 import pandas as pd
      6 df = pd.read_csv('data.csv')
----> 8 x = df["Calories"].median()
     10 df["Calories"].fillna(x, inplace = True)

File ~\anaconda3\Lib\site-packages\pandas\core\frame.py:3807, in DataFrame.__getitem__(self, key)
   3805 if self.columns.nlevels > 1:
   3806     return self._getitem_multilevel(key)
-> 3807 indexer = self.columns.get_loc(key)
   3808 if is_integer(indexer):
   3809     indexer = [indexer]

File ~\anaconda3\Lib\site-packages\pandas\core\indexes\base.py:3804, in Index.get_loc(self, key, method, tolerance)
   3802     return self._engine.get_loc(casted_key)
   3803 except KeyError as err:
-> 3804     raise KeyError(key) from err
   3805 except TypeError:
   3806     # If we have a listlike key, _check_indexing_error will raise
   3807     #  InvalidIndexError. Otherwise we fall through and re-raise
   3808     #  the TypeError.
   3809     self._check_indexing_error(key)

KeyError: 'Calories'
### Ví dụ
### Tính MODE và thay thế mọi giá trị trống bằng nó:
### sử dụng mode = là giá trị thường xuyên xuất hiện nhất.
import pandas as pd

df = pd.read_csv('data.csv')

x = df["Calories"].mode()[0]

df["Calories"].fillna(x, inplace = True)
---------------------------------------------------------------------------
KeyError                                  Traceback (most recent call last)
File ~\anaconda3\Lib\site-packages\pandas\core\indexes\base.py:3802, in Index.get_loc(self, key, method, tolerance)
   3801 try:
-> 3802     return self._engine.get_loc(casted_key)
   3803 except KeyError as err:

File ~\anaconda3\Lib\site-packages\pandas\_libs\index.pyx:138, in pandas._libs.index.IndexEngine.get_loc()

File ~\anaconda3\Lib\site-packages\pandas\_libs\index.pyx:165, in pandas._libs.index.IndexEngine.get_loc()

File pandas\_libs\hashtable_class_helper.pxi:5745, in pandas._libs.hashtable.PyObjectHashTable.get_item()

File pandas\_libs\hashtable_class_helper.pxi:5753, in pandas._libs.hashtable.PyObjectHashTable.get_item()

KeyError: 'Calories'

The above exception was the direct cause of the following exception:

KeyError                                  Traceback (most recent call last)
Cell In[114], line 8
      4 import pandas as pd
      6 df = pd.read_csv('data.csv')
----> 8 x = df["Calories"].mode()[0]
     10 df["Calories"].fillna(x, inplace = True)

File ~\anaconda3\Lib\site-packages\pandas\core\frame.py:3807, in DataFrame.__getitem__(self, key)
   3805 if self.columns.nlevels > 1:
   3806     return self._getitem_multilevel(key)
-> 3807 indexer = self.columns.get_loc(key)
   3808 if is_integer(indexer):
   3809     indexer = [indexer]

File ~\anaconda3\Lib\site-packages\pandas\core\indexes\base.py:3804, in Index.get_loc(self, key, method, tolerance)
   3802     return self._engine.get_loc(casted_key)
   3803 except KeyError as err:
-> 3804     raise KeyError(key) from err
   3805 except TypeError:
   3806     # If we have a listlike key, _check_indexing_error will raise
   3807     #  InvalidIndexError. Otherwise we fall through and re-raise
   3808     #  the TypeError.
   3809     self._check_indexing_error(key)

KeyError: 'Calories'
1.2.1.2.2. Pandas - Cleaning Data of Wrong Format (Làm sạch dữ liệu có định dạng sai)#
1.2.1.2.2.1. Convert Into a Correct Format (Chuyển đổi thành định dạng chính xác)#
Pandas sử dụng to_datetime()phương pháp cho việc này:
ngày đg bị sai nên chỉnh lại
### Chuyển đổi sang ngày:

import pandas as pd

df = pd.read_csv('data.csv')

df['Date'] = pd.to_datetime(df['Date'])

print(df.to_string())
---------------------------------------------------------------------------
KeyError                                  Traceback (most recent call last)
File ~\anaconda3\Lib\site-packages\pandas\core\indexes\base.py:3802, in Index.get_loc(self, key, method, tolerance)
   3801 try:
-> 3802     return self._engine.get_loc(casted_key)
   3803 except KeyError as err:

File ~\anaconda3\Lib\site-packages\pandas\_libs\index.pyx:138, in pandas._libs.index.IndexEngine.get_loc()

File ~\anaconda3\Lib\site-packages\pandas\_libs\index.pyx:165, in pandas._libs.index.IndexEngine.get_loc()

File pandas\_libs\hashtable_class_helper.pxi:5745, in pandas._libs.hashtable.PyObjectHashTable.get_item()

File pandas\_libs\hashtable_class_helper.pxi:5753, in pandas._libs.hashtable.PyObjectHashTable.get_item()

KeyError: 'Date'

The above exception was the direct cause of the following exception:

KeyError                                  Traceback (most recent call last)
Cell In[115], line 7
      3 import pandas as pd
      5 df = pd.read_csv('data.csv')
----> 7 df['Date'] = pd.to_datetime(df['Date'])
      9 print(df.to_string())

File ~\anaconda3\Lib\site-packages\pandas\core\frame.py:3807, in DataFrame.__getitem__(self, key)
   3805 if self.columns.nlevels > 1:
   3806     return self._getitem_multilevel(key)
-> 3807 indexer = self.columns.get_loc(key)
   3808 if is_integer(indexer):
   3809     indexer = [indexer]

File ~\anaconda3\Lib\site-packages\pandas\core\indexes\base.py:3804, in Index.get_loc(self, key, method, tolerance)
   3802     return self._engine.get_loc(casted_key)
   3803 except KeyError as err:
-> 3804     raise KeyError(key) from err
   3805 except TypeError:
   3806     # If we have a listlike key, _check_indexing_error will raise
   3807     #  InvalidIndexError. Otherwise we fall through and re-raise
   3808     #  the TypeError.
   3809     self._check_indexing_error(key)

KeyError: 'Date'
1.2.1.2.2.2. Removing Rows (xóa hàng)#
Kết quả từ việc chuyển đổi trong ví dụ trên đã cho chúng ta một giá trị NaT, giá trị này có thể được xử lý dưới dạng giá trị NULL và chúng ta có thể xóa hàng bằng cách sử dụng phương thức dropna().
VD Xóa các hàng có giá trị NULL trong cột “Ngày”:
import pandas as pd

df = pd.read_csv('data.csv')

df['Date'] = pd.to_datetime(df['Date'])

df.dropna(subset=['Date'], inplace = True)

print(df.to_string())
---------------------------------------------------------------------------
KeyError                                  Traceback (most recent call last)
File ~\anaconda3\Lib\site-packages\pandas\core\indexes\base.py:3802, in Index.get_loc(self, key, method, tolerance)
   3801 try:
-> 3802     return self._engine.get_loc(casted_key)
   3803 except KeyError as err:

File ~\anaconda3\Lib\site-packages\pandas\_libs\index.pyx:138, in pandas._libs.index.IndexEngine.get_loc()

File ~\anaconda3\Lib\site-packages\pandas\_libs\index.pyx:165, in pandas._libs.index.IndexEngine.get_loc()

File pandas\_libs\hashtable_class_helper.pxi:5745, in pandas._libs.hashtable.PyObjectHashTable.get_item()

File pandas\_libs\hashtable_class_helper.pxi:5753, in pandas._libs.hashtable.PyObjectHashTable.get_item()

KeyError: 'Date'

The above exception was the direct cause of the following exception:

KeyError                                  Traceback (most recent call last)
Cell In[116], line 5
      1 import pandas as pd
      3 df = pd.read_csv('data.csv')
----> 5 df['Date'] = pd.to_datetime(df['Date'])
      7 df.dropna(subset=['Date'], inplace = True)
      9 print(df.to_string())

File ~\anaconda3\Lib\site-packages\pandas\core\frame.py:3807, in DataFrame.__getitem__(self, key)
   3805 if self.columns.nlevels > 1:
   3806     return self._getitem_multilevel(key)
-> 3807 indexer = self.columns.get_loc(key)
   3808 if is_integer(indexer):
   3809     indexer = [indexer]

File ~\anaconda3\Lib\site-packages\pandas\core\indexes\base.py:3804, in Index.get_loc(self, key, method, tolerance)
   3802     return self._engine.get_loc(casted_key)
   3803 except KeyError as err:
-> 3804     raise KeyError(key) from err
   3805 except TypeError:
   3806     # If we have a listlike key, _check_indexing_error will raise
   3807     #  InvalidIndexError. Otherwise we fall through and re-raise
   3808     #  the TypeError.
   3809     self._check_indexing_error(key)

KeyError: 'Date'
1.2.1.2.3. Pandas - Fixing Wrong Data (sửa dữ liệu sai)#
1.2.1.2.3.1. Wrong Data (sửa dữ liệu sai)#
1.2.1.2.3.1.1. Replacing Values (Thay thế giá trị)#
ví dụ như là đoạn dòng thứ 7 của file bị sai lên sửa lại ta làm như sau :
import pandas as pd

df = pd.read_csv('data.csv')

df.loc[7,'Duration'] = 45

print(df.to_string())
   Unnamed: 0     contents                              infos  numbers  Duration
0         0.0       Author                    Pham Dinh Khanh   1993.0       NaN
1         1.0         Book          ML algorithms to Practice   2021.0       NaN
2         2.0       Target  Vi mot cong dong AI vung manh hon      1.0       NaN
3         3.0  No_Donation                          Community      2.0       NaN
7         NaN          NaN                                NaN      NaN      45.0
nếu phải thay chỗ sai nhiều hơn thì sao, nên ta dùng cách dưới đây
#### Ví dụ Lặp lại tất cả các giá trị trong cột "Thời lượng".

### Nếu giá trị cao hơn 120, hãy đặt thành 120:

import pandas as pd
df = pd.read_csv('data.csv')
for x in df.index:
  if df.loc[x, "Duration"] > 120:
    df.loc[x, "Duration"] = 120
print(df.to_string())
---------------------------------------------------------------------------
KeyError                                  Traceback (most recent call last)
File ~\anaconda3\Lib\site-packages\pandas\core\indexes\base.py:3802, in Index.get_loc(self, key, method, tolerance)
   3801 try:
-> 3802     return self._engine.get_loc(casted_key)
   3803 except KeyError as err:

File ~\anaconda3\Lib\site-packages\pandas\_libs\index.pyx:138, in pandas._libs.index.IndexEngine.get_loc()

File ~\anaconda3\Lib\site-packages\pandas\_libs\index.pyx:165, in pandas._libs.index.IndexEngine.get_loc()

File pandas\_libs\hashtable_class_helper.pxi:5745, in pandas._libs.hashtable.PyObjectHashTable.get_item()

File pandas\_libs\hashtable_class_helper.pxi:5753, in pandas._libs.hashtable.PyObjectHashTable.get_item()

KeyError: 'Duration'

The above exception was the direct cause of the following exception:

KeyError                                  Traceback (most recent call last)
Cell In[118], line 8
      6 df = pd.read_csv('data.csv')
      7 for x in df.index:
----> 8   if df.loc[x, "Duration"] > 120:
      9     df.loc[x, "Duration"] = 120
     10 print(df.to_string())

File ~\anaconda3\Lib\site-packages\pandas\core\indexing.py:1066, in _LocationIndexer.__getitem__(self, key)
   1064     key = tuple(com.apply_if_callable(x, self.obj) for x in key)
   1065     if self._is_scalar_access(key):
-> 1066         return self.obj._get_value(*key, takeable=self._takeable)
   1067     return self._getitem_tuple(key)
   1068 else:
   1069     # we by definition only have the 0th axis

File ~\anaconda3\Lib\site-packages\pandas\core\frame.py:3917, in DataFrame._get_value(self, index, col, takeable)
   3914     series = self._ixs(col, axis=1)
   3915     return series._values[index]
-> 3917 series = self._get_item_cache(col)
   3918 engine = self.index._engine
   3920 if not isinstance(self.index, MultiIndex):
   3921     # CategoricalIndex: Trying to use the engine fastpath may give incorrect
   3922     #  results if our categories are integers that dont match our codes
   3923     # IntervalIndex: IntervalTree has no get_loc

File ~\anaconda3\Lib\site-packages\pandas\core\frame.py:4282, in DataFrame._get_item_cache(self, item)
   4277 res = cache.get(item)
   4278 if res is None:
   4279     # All places that call _get_item_cache have unique columns,
   4280     #  pending resolution of GH#33047
-> 4282     loc = self.columns.get_loc(item)
   4283     res = self._ixs(loc, axis=1)
   4285     cache[item] = res

File ~\anaconda3\Lib\site-packages\pandas\core\indexes\base.py:3804, in Index.get_loc(self, key, method, tolerance)
   3802     return self._engine.get_loc(casted_key)
   3803 except KeyError as err:
-> 3804     raise KeyError(key) from err
   3805 except TypeError:
   3806     # If we have a listlike key, _check_indexing_error will raise
   3807     #  InvalidIndexError. Otherwise we fall through and re-raise
   3808     #  the TypeError.
   3809     self._check_indexing_error(key)

KeyError: 'Duration'
1.2.1.2.3.2. Removing Rows (xóa hàng)#
đôi khi bạn có thể xóa cả hàng đó thay vì bạn sửa 1 hoặc nhiều lỗi sai của hàng
import pandas as pd

df = pd.read_csv('data.csv')

for x in df.index:
  if df.loc[x, "Duration"] > 120:
    df.drop(x, inplace = True)
print(df.to_string())
---------------------------------------------------------------------------
KeyError                                  Traceback (most recent call last)
File ~\anaconda3\Lib\site-packages\pandas\core\indexes\base.py:3802, in Index.get_loc(self, key, method, tolerance)
   3801 try:
-> 3802     return self._engine.get_loc(casted_key)
   3803 except KeyError as err:

File ~\anaconda3\Lib\site-packages\pandas\_libs\index.pyx:138, in pandas._libs.index.IndexEngine.get_loc()

File ~\anaconda3\Lib\site-packages\pandas\_libs\index.pyx:165, in pandas._libs.index.IndexEngine.get_loc()

File pandas\_libs\hashtable_class_helper.pxi:5745, in pandas._libs.hashtable.PyObjectHashTable.get_item()

File pandas\_libs\hashtable_class_helper.pxi:5753, in pandas._libs.hashtable.PyObjectHashTable.get_item()

KeyError: 'Duration'

The above exception was the direct cause of the following exception:

KeyError                                  Traceback (most recent call last)
Cell In[119], line 6
      3 df = pd.read_csv('data.csv')
      5 for x in df.index:
----> 6   if df.loc[x, "Duration"] > 120:
      7     df.drop(x, inplace = True)
      8 print(df.to_string())

File ~\anaconda3\Lib\site-packages\pandas\core\indexing.py:1066, in _LocationIndexer.__getitem__(self, key)
   1064     key = tuple(com.apply_if_callable(x, self.obj) for x in key)
   1065     if self._is_scalar_access(key):
-> 1066         return self.obj._get_value(*key, takeable=self._takeable)
   1067     return self._getitem_tuple(key)
   1068 else:
   1069     # we by definition only have the 0th axis

File ~\anaconda3\Lib\site-packages\pandas\core\frame.py:3917, in DataFrame._get_value(self, index, col, takeable)
   3914     series = self._ixs(col, axis=1)
   3915     return series._values[index]
-> 3917 series = self._get_item_cache(col)
   3918 engine = self.index._engine
   3920 if not isinstance(self.index, MultiIndex):
   3921     # CategoricalIndex: Trying to use the engine fastpath may give incorrect
   3922     #  results if our categories are integers that dont match our codes
   3923     # IntervalIndex: IntervalTree has no get_loc

File ~\anaconda3\Lib\site-packages\pandas\core\frame.py:4282, in DataFrame._get_item_cache(self, item)
   4277 res = cache.get(item)
   4278 if res is None:
   4279     # All places that call _get_item_cache have unique columns,
   4280     #  pending resolution of GH#33047
-> 4282     loc = self.columns.get_loc(item)
   4283     res = self._ixs(loc, axis=1)
   4285     cache[item] = res

File ~\anaconda3\Lib\site-packages\pandas\core\indexes\base.py:3804, in Index.get_loc(self, key, method, tolerance)
   3802     return self._engine.get_loc(casted_key)
   3803 except KeyError as err:
-> 3804     raise KeyError(key) from err
   3805 except TypeError:
   3806     # If we have a listlike key, _check_indexing_error will raise
   3807     #  InvalidIndexError. Otherwise we fall through and re-raise
   3808     #  the TypeError.
   3809     self._check_indexing_error(key)

KeyError: 'Duration'
1.2.1.2.4. Pandas - Removing Duplicates (Loại bỏ trùng lặp)#
1.2.1.2.4.1. Discovering Duplicates (khám phá bản trùng lặp)#
Để phát hiện các bản sao (trùng lặp), chúng ta có thể sử dụng duplicated() phương pháp này.
Phương thức duplicated() là phương thức trả về giá trị Boolean cho mỗi hàng: nếu có cái lặp thì sẽ là true nếu k có cái lặp thì là flase.
import pandas as pd
df = pd.read_csv('data.csv')
print(df.duplicated())
0    False
1    False
2    False
3    False
dtype: bool
1.2.1.2.4.2. Removing Duplicates (loại bỏ trùng lặp)#
Để loại bỏ trùng lặp, hãy sử dụng drop_duplicates() .
xóa tất cả những cái bị trùng
Hãy nhớ: Phương thức này (inplace = True)sẽ đảm bảo rằng phương thức KHÔNG trả về DataFrame mới nhưng sẽ xóa tất cả các bản sao khỏi DataFrame gốc.
import pandas as pd

df = pd.read_csv('data.csv')

df.drop_duplicates(inplace = True)

print(df.to_string())
   Unnamed: 0     contents                              infos  numbers
0           0       Author                    Pham Dinh Khanh     1993
1           1         Book          ML algorithms to Practice     2021
2           2       Target  Vi mot cong dong AI vung manh hon        1
3           3  No_Donation                          Community        2
1.2.1.2.5. Pandas - Data Correlations (Tương quan dữ liệu)#
1.2.1.2.5.1. Finding Relationships (tìm mối quan hệ)#
Phương thức này corr() bỏ qua các cột “không phải số”.
import pandas as pd

df = pd.read_csv('data.csv')

print(df.corr())
            Unnamed: 0  numbers
Unnamed: 0     1.00000 -0.89115
numbers       -0.89115  1.00000
Kết quả được giải thích
Kết quả của corr()phương pháp là một bảng có rất nhiều số thể hiện mối quan hệ giữa hai cột tốt như thế nào.Số thay đổi từ -1 đến 1.
1 có nghĩa là có mối quan hệ 1-1 (một mối tương quan hoàn hảo) và đối với tập dữ liệu này, mỗi khi một giá trị tăng lên trong cột đầu tiên thì giá trị kia cũng tăng theo. 0,9 cũng là một mối quan hệ tốt và nếu bạn tăng một giá trị thì giá trị kia có thể cũng sẽ tăng. -0,9 cũng có mối quan hệ tốt như 0,9, nhưng nếu bạn tăng một giá trị thì giá trị kia có thể sẽ giảm xuống. 0,2 có nghĩa KHÔNG phải là một mối quan hệ tốt, nghĩa là nếu một giá trị tăng lên không có nghĩa là giá trị kia sẽ tăng.
Một mối tương quan tốt là gì? Nó phụ thuộc vào việc sử dụng, nhưng tôi nghĩ sẽ an toàn khi nói rằng bạn phải có ít nhất 0.6(hoặc -0.6) để gọi đó là mối tương quan tốt.
Tương quan hoàn hảo: Chúng ta có thể thấy rằng “Duration” và “Duration” có số 1.000000, điều này rất hợp lý, mỗi cột luôn có mối quan hệ hoàn hảo với chính nó.
Tương quan tốt: “Thời lượng” và “Calo” có mối 0.922721tương quan, đó là mối tương quan rất tốt và chúng tôi có thể dự đoán rằng bạn tập luyện càng lâu thì bạn càng đốt cháy nhiều calo và ngược lại: nếu bạn đốt cháy nhiều calo, bạn có lẽ đã phải làm việc lâu dài.
Tương quan xấu: “Thời lượng” và “Maxpulse” có 0.009403mối tương quan, đây là mối tương quan rất xấu, nghĩa là chúng ta không thể dự đoán xung tối đa chỉ bằng cách nhìn vào thời lượng tập luyện và ngược lại.’
1.2.1.2.6. Pandas - Plotting (vẽ đồ thị)#
1.2.1.2.6.1. Plotting (vẽ đồ thị)#
Pandas sử dụng plot()phương pháp này để tạo sơ đồ.
Chúng ta có thể sử dụng Pyplot, một mô-đun con của thư viện Matplotlib để hiển thị sơ đồ trên màn hình.
#Three lines to make our compiler able to draw:
import sys
import matplotlib
matplotlib.use('Agg')

import pandas as pd
import matplotlib.pyplot as plt

df = pd.read_csv('data.csv')

df.plot()

plt.show()

#Two  lines to make our compiler able to draw:
plt.savefig(sys.stdout.buffer)
sys.stdout.flush()
---------------------------------------------------------------------------
AttributeError                            Traceback (most recent call last)
Cell In[125], line 16
     13 plt.show()
     15 #Two  lines to make our compiler able to draw:
---> 16 plt.savefig(sys.stdout.buffer)
     17 sys.stdout.flush()

AttributeError: 'OutStream' object has no attribute 'buffer'
1.2.1.2.6.2. Scatter Plot (biểu đồ phân tán)#
sử dụng “Thời lượng” cho trục x và “Calo” cho trục y.
Bao gồm các đối số x và y như thế này:
x = ‘Duration’, y = ‘Calories’
Ví dụ
import pandas as pd
import matplotlib.pyplot as plt

df = pd.read_csv('data.csv')

df.plot(kind = 'scatter', x = 'Duration', y = 'Calories')

plt.show()
---------------------------------------------------------------------------
KeyError                                  Traceback (most recent call last)
File ~\anaconda3\Lib\site-packages\pandas\core\indexes\base.py:3802, in Index.get_loc(self, key, method, tolerance)
   3801 try:
-> 3802     return self._engine.get_loc(casted_key)
   3803 except KeyError as err:

File ~\anaconda3\Lib\site-packages\pandas\_libs\index.pyx:138, in pandas._libs.index.IndexEngine.get_loc()

File ~\anaconda3\Lib\site-packages\pandas\_libs\index.pyx:165, in pandas._libs.index.IndexEngine.get_loc()

File pandas\_libs\hashtable_class_helper.pxi:5745, in pandas._libs.hashtable.PyObjectHashTable.get_item()

File pandas\_libs\hashtable_class_helper.pxi:5753, in pandas._libs.hashtable.PyObjectHashTable.get_item()

KeyError: 'Duration'

The above exception was the direct cause of the following exception:

KeyError                                  Traceback (most recent call last)
Cell In[126], line 6
      2 import matplotlib.pyplot as plt
      4 df = pd.read_csv('data.csv')
----> 6 df.plot(kind = 'scatter', x = 'Duration', y = 'Calories')
      8 plt.show()

File ~\anaconda3\Lib\site-packages\pandas\plotting\_core.py:945, in PlotAccessor.__call__(self, *args, **kwargs)
    943 if kind in self._dataframe_kinds:
    944     if isinstance(data, ABCDataFrame):
--> 945         return plot_backend.plot(data, x=x, y=y, kind=kind, **kwargs)
    946     else:
    947         raise ValueError(f"plot kind {kind} can only be used for data frames")

File ~\anaconda3\Lib\site-packages\pandas\plotting\_matplotlib\__init__.py:71, in plot(data, kind, **kwargs)
     69         kwargs["ax"] = getattr(ax, "left_ax", ax)
     70 plot_obj = PLOT_CLASSES[kind](data, **kwargs)
---> 71 plot_obj.generate()
     72 plot_obj.draw()
     73 return plot_obj.result

File ~\anaconda3\Lib\site-packages\pandas\plotting\_matplotlib\core.py:452, in MPLPlot.generate(self)
    450 self._compute_plot_data()
    451 self._setup_subplots()
--> 452 self._make_plot()
    453 self._add_table()
    454 self._make_legend()

File ~\anaconda3\Lib\site-packages\pandas\plotting\_matplotlib\core.py:1260, in ScatterPlot._make_plot(self)
   1257 else:
   1258     label = None
   1259 scatter = ax.scatter(
-> 1260     data[x].values,
   1261     data[y].values,
   1262     c=c_values,
   1263     label=label,
   1264     cmap=cmap,
   1265     norm=norm,
   1266     **self.kwds,
   1267 )
   1268 if cb:
   1269     cbar_label = c if c_is_column else ""

File ~\anaconda3\Lib\site-packages\pandas\core\frame.py:3807, in DataFrame.__getitem__(self, key)
   3805 if self.columns.nlevels > 1:
   3806     return self._getitem_multilevel(key)
-> 3807 indexer = self.columns.get_loc(key)
   3808 if is_integer(indexer):
   3809     indexer = [indexer]

File ~\anaconda3\Lib\site-packages\pandas\core\indexes\base.py:3804, in Index.get_loc(self, key, method, tolerance)
   3802     return self._engine.get_loc(casted_key)
   3803 except KeyError as err:
-> 3804     raise KeyError(key) from err
   3805 except TypeError:
   3806     # If we have a listlike key, _check_indexing_error will raise
   3807     #  InvalidIndexError. Otherwise we fall through and re-raise
   3808     #  the TypeError.
   3809     self._check_indexing_error(key)

KeyError: 'Duration'
### bảng đồ thị khác
import pandas as pd
import matplotlib.pyplot as plt

df = pd.read_csv('data.csv')

df.plot(kind = 'scatter', x = 'Duration', y = 'Maxpulse')

plt.show()
---------------------------------------------------------------------------
KeyError                                  Traceback (most recent call last)
File ~\anaconda3\Lib\site-packages\pandas\core\indexes\base.py:3802, in Index.get_loc(self, key, method, tolerance)
   3801 try:
-> 3802     return self._engine.get_loc(casted_key)
   3803 except KeyError as err:

File ~\anaconda3\Lib\site-packages\pandas\_libs\index.pyx:138, in pandas._libs.index.IndexEngine.get_loc()

File ~\anaconda3\Lib\site-packages\pandas\_libs\index.pyx:165, in pandas._libs.index.IndexEngine.get_loc()

File pandas\_libs\hashtable_class_helper.pxi:5745, in pandas._libs.hashtable.PyObjectHashTable.get_item()

File pandas\_libs\hashtable_class_helper.pxi:5753, in pandas._libs.hashtable.PyObjectHashTable.get_item()

KeyError: 'Duration'

The above exception was the direct cause of the following exception:

KeyError                                  Traceback (most recent call last)
Cell In[127], line 7
      3 import matplotlib.pyplot as plt
      5 df = pd.read_csv('data.csv')
----> 7 df.plot(kind = 'scatter', x = 'Duration', y = 'Maxpulse')
      9 plt.show()

File ~\anaconda3\Lib\site-packages\pandas\plotting\_core.py:945, in PlotAccessor.__call__(self, *args, **kwargs)
    943 if kind in self._dataframe_kinds:
    944     if isinstance(data, ABCDataFrame):
--> 945         return plot_backend.plot(data, x=x, y=y, kind=kind, **kwargs)
    946     else:
    947         raise ValueError(f"plot kind {kind} can only be used for data frames")

File ~\anaconda3\Lib\site-packages\pandas\plotting\_matplotlib\__init__.py:71, in plot(data, kind, **kwargs)
     69         kwargs["ax"] = getattr(ax, "left_ax", ax)
     70 plot_obj = PLOT_CLASSES[kind](data, **kwargs)
---> 71 plot_obj.generate()
     72 plot_obj.draw()
     73 return plot_obj.result

File ~\anaconda3\Lib\site-packages\pandas\plotting\_matplotlib\core.py:452, in MPLPlot.generate(self)
    450 self._compute_plot_data()
    451 self._setup_subplots()
--> 452 self._make_plot()
    453 self._add_table()
    454 self._make_legend()

File ~\anaconda3\Lib\site-packages\pandas\plotting\_matplotlib\core.py:1260, in ScatterPlot._make_plot(self)
   1257 else:
   1258     label = None
   1259 scatter = ax.scatter(
-> 1260     data[x].values,
   1261     data[y].values,
   1262     c=c_values,
   1263     label=label,
   1264     cmap=cmap,
   1265     norm=norm,
   1266     **self.kwds,
   1267 )
   1268 if cb:
   1269     cbar_label = c if c_is_column else ""

File ~\anaconda3\Lib\site-packages\pandas\core\frame.py:3807, in DataFrame.__getitem__(self, key)
   3805 if self.columns.nlevels > 1:
   3806     return self._getitem_multilevel(key)
-> 3807 indexer = self.columns.get_loc(key)
   3808 if is_integer(indexer):
   3809     indexer = [indexer]

File ~\anaconda3\Lib\site-packages\pandas\core\indexes\base.py:3804, in Index.get_loc(self, key, method, tolerance)
   3802     return self._engine.get_loc(casted_key)
   3803 except KeyError as err:
-> 3804     raise KeyError(key) from err
   3805 except TypeError:
   3806     # If we have a listlike key, _check_indexing_error will raise
   3807     #  InvalidIndexError. Otherwise we fall through and re-raise
   3808     #  the TypeError.
   3809     self._check_indexing_error(key)

KeyError: 'Duration'
1.2.1.2.6.3. Histogram (biểu đồ)#
#Three lines to make our compiler able to draw:
import sys
import matplotlib
matplotlib.use('Agg')

import pandas as pd
import matplotlib.pyplot as plt

df = pd.read_csv('data.csv')

df["Duration"].plot(kind = 'hist')

plt.show()

#Two  lines to make our compiler able to draw:
plt.savefig(sys.stdout.buffer)
sys.stdout.flush()
---------------------------------------------------------------------------
KeyError                                  Traceback (most recent call last)
File ~\anaconda3\Lib\site-packages\pandas\core\indexes\base.py:3802, in Index.get_loc(self, key, method, tolerance)
   3801 try:
-> 3802     return self._engine.get_loc(casted_key)
   3803 except KeyError as err:

File ~\anaconda3\Lib\site-packages\pandas\_libs\index.pyx:138, in pandas._libs.index.IndexEngine.get_loc()

File ~\anaconda3\Lib\site-packages\pandas\_libs\index.pyx:165, in pandas._libs.index.IndexEngine.get_loc()

File pandas\_libs\hashtable_class_helper.pxi:5745, in pandas._libs.hashtable.PyObjectHashTable.get_item()

File pandas\_libs\hashtable_class_helper.pxi:5753, in pandas._libs.hashtable.PyObjectHashTable.get_item()

KeyError: 'Duration'

The above exception was the direct cause of the following exception:

KeyError                                  Traceback (most recent call last)
Cell In[128], line 11
      7 import matplotlib.pyplot as plt
      9 df = pd.read_csv('data.csv')
---> 11 df["Duration"].plot(kind = 'hist')
     13 plt.show()
     15 #Two  lines to make our compiler able to draw:

File ~\anaconda3\Lib\site-packages\pandas\core\frame.py:3807, in DataFrame.__getitem__(self, key)
   3805 if self.columns.nlevels > 1:
   3806     return self._getitem_multilevel(key)
-> 3807 indexer = self.columns.get_loc(key)
   3808 if is_integer(indexer):
   3809     indexer = [indexer]

File ~\anaconda3\Lib\site-packages\pandas\core\indexes\base.py:3804, in Index.get_loc(self, key, method, tolerance)
   3802     return self._engine.get_loc(casted_key)
   3803 except KeyError as err:
-> 3804     raise KeyError(key) from err
   3805 except TypeError:
   3806     # If we have a listlike key, _check_indexing_error will raise
   3807     #  InvalidIndexError. Otherwise we fall through and re-raise
   3808     #  the TypeError.
   3809     self._check_indexing_error(key)

KeyError: 'Duration'